
Final Report
Effects of Longwall Mining
On Real Property Value and the Tax Base
of Greene and Washington Counties, Pennsylvania
Commonwealth of Pennsylvania
Department of Environmental Protection
Bureau of Mining and Reclamation
Contract No. BMR-00-02
Prepared by
Jeffrey R. Kern, MRP, ASA, State Certified, General Appraiser
David Falkenstern, MS, Project Manager
Ronald W. Stingelin, Ph.D., Registered Professional Geologist
November 8, 2002
TABLE OF CONTENTS
1.2 Mining Methods and Mine Subsidence
1.3 Coal Ownership, the Estate of Coal, and the Right to Subside
2.4 Pittsburgh Coalbed – A Geologic Description
2.5 Status of Longwall Mining in Southwestern Pennsylvania
4.0 SALE AND COUNTY VALUE OF LONGWALL AND NON-LONGWALL PROPERTIES
4.2 Sale and County Value Comparisons
4.2.2 Control Area Selection Methodology
5.0 ANALYSIS OF ASSESSMENT CHANGES RELATED TO APPEALS
5.2 Long- Term and Short-Term Assessment Changes
5.2.3 Longwall Mining Damage and Compensation Process
6.0 STUDY OF TAX REVENUES FROM COAL MINING
7.0 LONGWALL ANECDOTAL INFORMATION (MEDIA REPORTS)
This study was designed to determine if longwall coal mining has had an effect on residential property values, and the real estate tax bases of Greene and Washington Counties. In short, the study is intended to determine if there are broad relationships between longwall mining and the:
● Assessed value of residential properties.
● Sale prices of residential properties.
● Tax revenue available to the county
Since the research was intended to discover overall trends or common factors, the effort used generalized information (averages, approximate location, etc.) to examine these issues. Conclusions developed by the study are, therefore, general in nature. Individual properties may or may not conform to the following overall trends:
● There is a relationship between location with respect to longwall mining and the assessed valuation as determined by the county.
● There appears to be no consistent relationship between the sales price of properties and presence of longwall mining.
● There is a relationship between the number of assessment appeals and the amount of assessment appeals and longwall mining. While most property owners do not appeal taxes, more appeal in longwall areas than in similar non-longwall areas.
● Taxes generated from longwall operations exceed the tax reductions granted to surface properties overlying longwall mines.
● Total compensation (including damage and incidental expenses) provided by the coal companies for surface damage exceeds the total value reductions determined in assessment appeals. The experience of individual properties may vary.
The analysis period of 1993 to 2002 was selected to represent a period of significant mine development, to capture assessment appeals and assessment changes, to capture residential property sales, and to capture compensation claims and payments. With the exception of compensation records all analysis is based on available public records including:
● Property assessment records
● Sales records
● Historic mining records and maps
In addition, confidential coal company reimbursement records were examined. A confidentiality agreement was used to allow the review of a portion of the records.
To complete the study, value as recorded by the individual counties had to be standardized. County assessment records show an assessed value as of the date of the assessment. The assessed value of property is related to an approximate market value (the value a property ought to sell for) by way of the assessment ratio. Each county uses different pre-established assessment ratios. These ratios are checked by the counties and the state each year to determine a “current ratio”. For this study the assessed value was divided by the current ratio to estimate or imply a “county value” – a rough approximation of market value. This allowed the analysis to compare information across county lines and to compare tax revenue gained or lost by assessment appeal results and coal mine development. It must be emphasized that “county value” is used to make comparisons among groups of properties by type and location, it does not represent the fair-market-value of individual properties.
In summary: The study indicates that there is a much stronger correlation between the county value of residential properties and access to public utilities (sewer and water) than between the county value and proximity to longwall mining.
The relationship between residential county value and mining is not consistent from place to place across either county. In contrast, the relationship between access to sewer and water is relatively consistent across both counties.
While undoubtedly the real estate truism: “value is derived from three factors – location, location, location,” is based in fact, in general, proximity to a longwall mine does not appear to be the major factor in determining “county value” and therefore assessed value. Other factors such as access to utilities (public sewer and water), proximity to major roads, density of residences, and the desirability of surrounding land uses appear more likely to influence the general taxable value (county value) of residential properties.
● The sales prices of residential properties sold during the study period was compared to the county value assigned to the property. The ratio of sales price to county value was compared to location with respect to longwall mining. There was no correlation between location with respect to longwall mining and the ratio of sales price to county value. Nearly the same proportion of properties sold for less than county value in the longwall areas as those that sold for less than the county value outside of the longwall areas. In fact, the proportions were nearly the same between longwall and non-longwall areas for properties selling for more than the county value and for properties selling at or near the county value.
● The statistical review did demonstrate that, on average, properties located above longwall mining operations are more likely to receive assessment reductions from County Assessment Boards than properties located elsewhere in the County. Obviously, the reduction in value granted by the counties reduces the taxable value of the individual parcels. However, the total reductions to date represent only a small portion of the tax base within the longwall mining areas. Less than half of the longwall related properties that were granted a tax reduction were later restored to the higher valuation. Over time this would appear to have resulted in the slightly average lower per acre county value in the longwall areas than in the non-mining areas of the counties.
● Of the records examined, coal companies typically pay more to the landowner for damages than the landowner is granted in county value reduction. The statistical review showed that the aggregate of coal company payments for damages exceeds the aggregate county value reductions granted by the assessment appeal boards. Comparison of county value reductions and individual damage settlements vary widely.
● County tax revenue generated by coal mining is significant. In Washington County longwall mine operators account for nearly 5% of the tax base. In the more rural Greene County, longwall operators account for nearly 30% of the countywide tax base. In southwest Washington and northwest Greene counties, longwall operators represent 50% of the local tax and school district bases.
● Longwall mining operations tend to be located in the more rural and remote sections of both counties. Thus, for the most part, the operations do not affect the more densely developed surface areas. As a result, while the operations cause subsidence and may cause significant damage to individual properties, the damages tend to be limited to a relatively small number of structures. On a per acre basis, the coal parcels associated with longwall mining operations are typically assessed at higher values than most other property types within these remote and rural areas in either Greene or Washington counties. In fact, active longwall mining coal parcels are assessed at twice or more per acre values than other mining and five to ten time the value of reserve coal tracts. For the most part, coal taxes are based on the market value of coal and the quantity of minable coal in place. The longwall mining operations are assessed at higher per acre values than other mining operations because there is more minable coal available. They are assessed at least five times higher than reserve coal tracts because reserve tracts are considered speculative and are not now generating income.
● To date, the annual property taxes generated from longwall coal mining has more than offset the annual tax revenue lost from those surface property assessment reductions related to longwall mining. However, unless the surface value is restored, this offset may be temporary. As the coal is mined, the taxable real estate value is depleted.
One of the issues identified for study was whether property values decrease in anticipation of mining – does the announcement of future mining cause a reduction of property values? Most mining area boundaries were established before the beginning of the study period (1993) making analysis of potential value changes related to the anticipation of mining difficult. Ideally, the analysis would involve paired sales – sales of the same property before and after the announcement of the mine plan. There were too few paired sales to complete this analysis. Instead, county records for the three year period prior to initiation of individual mine panels were searched to find assessment reductions that might be related to the anticipation of mining activity. These reductions could be indicators of a general relationship between future mining and a general unsupported opinion of value. There were not enough of these changes to reach any conclusions. Most assessment reductions were assigned after mining commenced.
Longwall mining causes surface property damage. The amount of damage to individual structures varies widely – with some structures receiving little measurable damage and others receiving substantial damage. The study showed that, overall, homeowners are receiving more in compensation than they are claiming as losses for property tax reductions. The study also showed that, overall, the receipt of compensation is not reflected in a restoration of taxable value to the counties - either the compensation is not being used to repair the properties or the counties are not often notified when repairs are completed. The study showed that there is no distinguishable correlation between the difference in sale values and assessments as they relate to the location of longwall mining. Other factors appear to affect value more significantly than mining – sewer, water, road access, etc. Finally, the taxes generated from longwall operations are significant but temporary.
Individual property experiences may differ from the overall trends identified in this study. To the extent that these individual experiences may be instructive they should be studied. In theory, properties that were granted reductions in assessment value due to damage caused by longwall mining should return to their original value after repair or compensation from the mining company. Just over 5,000 improved residential properties are located in the longwall regions of both counties. Of these, slightly under 3,000 are located in areas where longwall mining was active from 1993 through 2002. The vast majority of these properties did not file compensation claims or assessment appeals during the ten year period. In theory:
● Owners of Properties damaged by mining should file for and receive compensation
● Owners of Properties so damaged could also file for and receive either temporary or permanent tax relief (reduction in county value)
● The value of the compensation should somehow relate to the reduction in county value granted.
● Properties restored by way of compensation should return to or exceed the original county value.
As shown below, not all of the properties that received assessment reductions filed for claims and not all of the properties that filed for claims received assessment reductions. Only 95 of the properties received compensation and assessment reduction. Also as shown below, very few of the properties were ever returned to the original values (54).
401 Properties Noted as “Affected” by Longwall Mining By Assessment Appeals or Compensation Claims |
|||||||||||||||||||||
|
|
|
|
|
|||||||||||||||||
261 Properties: Assessed Value Reductions in Areas That Were Underlain by Longwall Mines |
|
235 Properties: Claims Filed Against Coal Companies During Same Time Period and Location |
|||||||||||||||||||
Of These: |
|
|
|
|
|
|
|
|
|
|
|||||||||||
166 Properties: Not Included in Coal Company Claims Lists |
|
140 Properties: Receiving Compensation Did Not Seek Property Assessment Reductions |
|||||||||||||||||||
|
95 Properties: Were Included in Both Data Sets; the Properties Were the Same |
|
|||||||||||||||||||
Of These: |
|
|
|
|
|
|
|||||||||||||||
|
20 Properties: Compensation less than the County Value Reduction |
|
|
75 Properties: Compensation Greater than County Value Reduction |
|||||||||||||||||
3 Years Later: |
|
||||||||||||||||||||
|
|
|
|
||||||||||||||||||
|
|
|
|||||||||||||||||||
41 Properties: County Value Restored to at Least Compensation Value |
|
54 Properties: County Value Not Restored |
|||||||||||||||||||
Future studies should focus on the evaluation of a subset of these 401 properties. The 95 properties where claims and assessment histories can be tracked could be studied in detail, if the home-owners and the coal companies agree to a releases of confidentially held settlement information. Additional studies might focus on:
● The rationale for not restoring the value to the original county value
● Not filing a compensation claim when an assessment appeal was filed
● Not filing an assessment appeal when a compensation claim was filed
This report will allow any future study to focus on specific issues at specific locations.
This report analyzes the effects that longwall mining may have on property values and tax revenues in Greene and Washington Counties, Pennsylvania. Section 1 of this report provides basic information about the terms and concepts discussed.
1.2 Mining Methods and Mine Subsidence
Throughout this report, we refer to two types of deep-mining methods that have dominated Pennsylvania’s underground coal mining: room-and-pillar mining and longwall mining. Before longwall mining was introduced, Pennsylvania coal miners used room-and-pillar mining to extract most of the deep coal produced in the state. Longwall mining was first used in Europe where it was found to be safer for miners and more efficient at extracting coal in mines where the equipment could be used. Today, longwall mining accounts for most of the coal produced in Pennsylvania. All of the currently active longwall mines in Pennsylvania are located in Greene and Washington Counties, where the Pittsburgh coal seam provides optimum conditions for using longwall technology.
 Room and Pillar Mining
In room-and-pillar mining, intersecting tunnels of varying width and length are mined throughout a coal seam. The method leaves a checkerboard effect of empty “rooms” (mined-out voids) and unmined “pillars,” which are blocks of coal left in place to prevent the ceilings of the rooms from collapsing on the miners. The pillars are essential to the further development of a typical room-and-pillar mine. Some of the protective pillars may be mined out (retreat mining) and some pillars may be left standing as mine operations end.
After a mine is closed (and often abandoned), pillars and ceilings can deteriorate over time from ground water flooding the empty rooms. When the pillars and ceilings rot, the rock above the ceilings can collapse without warning. As ceilings cave in, the downward movement of rock and soil can propagate up to the surface and cause subsidence, such as sinkholes or troughs. If a sinkhole, for example, is large enough, a house in its path can be damaged. Sinkholes and troughs may not occur above old room-and-pillar mines for 30 years or longer.
 Sinkhole Subsidence
Sinkhole subsidence is also known as pothole subsidence because of the deep and narrow holes (tens of feet in depth and in diameter) created as the earth subsides. Sinkholes usually occur when the ceiling of a mine room falls between pillars or when pillars collapse. Typically where sinkholes form, the mine is at a relatively shallow depth below the surface. Because old room and pillar mines have often been abandoned and the mine operator has gone out of business, DEP offers Mine Subsidence Insurance as a low-cost, long-term solution to handle this risk.
 Trough Subsidence
Trough subsidence looks more like a shallow and wide depression of a few feet deep and a 100 feet or larger in diameter. Troughs usually occur when pillars in an old mine deteriorate over a wide area causing larger roof collapses. Like sinkhole subsidence, trough subsidence over room-and-pillar mines usually occurs long after mining has ceased, but troughs can occur soon after pillars are removed during retreat mining. Troughs can be large enough to affect neighborhoods.
 Longwall Mining
In longwall mining, pillar-supported hallways(entries) are carved into the coal seam and wide (600 feet to 1,000 feet) panels of coal to be mined with longwall mining machinery are left between these entries. The entries provide access and ventilation to the workers and to the equipment mining the panel. Along the face of the panel, a longwall machine digs out all of the coal in its path across the seam between the entries. The machinery incorporates a system of supports that cover it and prevent the ceiling of the mine from collapsing and burying it and its operators. As a longwall mining machine moves forward into the coal seam, however, its supports move with it, and the ceiling behind the supports, which is no longer supported, collapses. The movement of falling rock and debris can propagate up to the surface of the earth as a large subsidence trough and can cause damage to overlying property.
Trough subsidence is the predominant subsidence associated with longwall mining where wide and long blocks of coal are completely mined out. A typical longwall panel today may be 1,000 feet wide and 10,000 feet long. Most trough subsidence occurs concurrently with longwall extraction of the coal, but residual subsidence may occur several months to a year after mining. Complete subsidence may take a year or two, and may be affected by mining of an adjacent panel. Important to this study, subsidence from longwall mining occurs while the mine operator is still in business and is legally bound to pay for damage to the surface. Research on the effects of subsidence on manmade surface structures and on springs, wells, and streams is discussed in Section 2.3 of this report.
Recently published reports required of the Pennsylvania Department of Environmental Protection (DEP) expand on these discussions. The four illustrations shown in this section are taken from these reports. Pennsylvania law that requires the DEP to assess the surface effects of underground mining on structures, water supplies, and streams every five years. The study period began in 1993. To prepare the report, DEP compiled information on 1,884 properties that were undermined between August 1993 and August 1998. A supplement to this report was published in February 2001. The supplemental study revealed that subsidence damage from underground mining was reported on nearly half of the properties in the study area. Of these properties, 70% of the damages were resolved by the time the study was published. As required by law, the mine operators had provided temporary and replacement water supplies, repaired land and structure damage, and compensated property owners.
1.3 Coal Ownership, the Estate of Coal, and the Right to Subside
Who owns the coal beneath the surface of land in Pennsylvania? Who owns the rights to extract coal from beneath the surface? Why are coal companies allowed to extract coal in a manner that can lead to subsidence and surface property damage? The answers to these questions lie within Pennsylvania’s legal definitions of real property, which includes rights to the surface, support of the surface, and the subsurface, including underground coal.
Title to all real property (real estate) in Pennsylvania, if traced back to the original title, includes full ownership rights to both the surface and the subsurface. Over time, many owners of real estate chose to convey by sale or lease their rights to subsurface coal to others, including mining companies. Often owners also sold or leased their right to the support of the surface, which, in essence, conveyed the right to mine the coal. With these transfers of property rights, a mine operator could mine subsurface coal without further encumbrance. Without the right of support, a surface owner had little recourse when surface damages were caused by underground mining of the coal.
Before 1966, the rights to support of the surface were defined only in a property’s title, as described in a property deed. The Bituminous Mine Subsidence and Land Conservation Act of 1966 modified those rights and provided many homeowners with protections against subsidence damage, which were not contained in their deeds. However, many others were left without such safeguards.
In 1994, Act 54 amended the 1966 Act to require mine operators to compensate all homeowners for damages caused by their underground coal mining operations. At the same time, Act 54 removed most rights that surface property owners had to the support of the surface, thereby allowing mine operators to mine under and cause damage to almost any structures. By passing Act 54, the General Assembly of the Commonwealth intended both to protect surface property owners from economic loss and to provide the coal mining industry in Pennsylvania a means to remain competitive in the world market.
With this study, DEP is seeking to learn the following:
• How does longwall mining activity affect the value, in general, of homes on the overlying surface property?
• If longwall mining affects the value of homes on the overlying surface property, how does such mining affect the property taxes that Greene and Washington Counties collect from homeowners?
• If longwall mining affects the property taxes that homeowners pay, how do the taxes that coal companies pay offset any gains or losses from homeowners’ taxes?
• How does longwall mining affect the taxes that coal companies pay on mined coal and the remaining coal reserves?
• Does longwall mining impact the value of properties scheduled to be undermined?
Resource Technologies Corporation was engaged by the Pennsylvania Department of Environmental Protection to analyze and report the effects that longwall mining may have on the value of residential properties and on the property tax bases of Greene and Washington Counties, PA. Two methods were considered to conduct such a study.
Method 1. Evaluate individual properties on an in-depth basis. By definition, this procedure would focus on specific properties damaged (or claimed to be damaged) by longwall mining activities. Because of time and financial limits this method could only have worked by using a small sampling of properties. Such a site-specific procedure could not adequately consider properties that have not been damaged by mining activities, nor properties not within the longwall mining areas. This method was rejected because of its limitations and because it would potentially violate confidentiality agreements between mine operators and home owners.
Method 2. Evaluate all real property sales and assessment data available. By definition, this method would require working with the different data sets to allow a fair comparison of sales and assessments. Similar data sets could be obtained from both counties, which maintain property assessments, assessment appeals, and sales records by tax record number. The tax record number contains a location coordinate (tax map number) that could be used to fix the general location of properties on a map. The maps could then be used to track the relationship of property value to longwall mining.
The average tax map in both counties contains approximately 350 acres and encompasses approximately 50 properties, with the average property containing 10 acres. To maintain privacy, individual properties included in the study would not be located precisely on any map (average location resolution is approximately 3,500 feet – that is, a property can be mapped within about three-quarters of a mile of the actual location). The longwall mines tend to be located in less densely populated areas of the counties. The average tax map in the longwall areas contains nearly 1,000 acres and encompasses approximately 40 properties, with the average property containing 25 acres. The tax map location number in the more rural longwall areas provides an average resolution of approximately 6,000 feet.
This method would rely on statistical analyses of summary data from property sales, county property tax assessments, and assessment appeals.
Method 2 was selected for this study because it protects the privacy of information on specific properties, while providing a comprehensive overview of trends and relationships between property values and longwall mining. Method 2 also provides a baseline of information that can be used in future studies of longwall mining’s effects.
This report presents the results of a comprehensive study of the effects of longwall mining on the value of surface property and on Greene and Washington Counties’ real estate tax bases. The report presents the results of statistical comparisons of sale prices and assessed values in areas overlying longwall panels and control areas without mining (Area Sets). The comparisons were carried out on two area sets in Washington County and three area sets in Greene County.
The report also evaluates the effect that longwall mining has on the rate of coal extraction and the effect the rate of extraction has on tax receipts from coal reserves and mined coal. Finally, the report addresses how tax revenues on longwall coal reserves, insurance claim payments, and coal company settlements offset potential property value losses.
The following questions are addressed:
1. Is there a quantifiable effect on the value of residential surface properties that overlie longwall operations?
A. Is there a relationship between proximity to longwall mining and sales price of properties?
B. Is there a relationship between proximity to longwall mining and assessed value?
C. Are there other factors that influence differences in value and do these factors relate to longwall locations?
2. What taxes are generated by longwall operations and how do they relate to other taxable real estate?
A. How do these taxes offset any gains or losses from homeowners’ taxes?
B. How does longwall mining affect the taxes that coal companies pay on mined coal and the remaining coal reserves?
3. Does longwall mining impact the value of properties scheduled to be undermined?
Among homeowners, some will say that no amount of money can compensate for the fear and worry of one’s home being undermined. Others will say they have been fully compensated, and still others will say their property was not damaged when the longwall passed underneath.
Among the coal operators, some will say that property owners are “made whole” by the payments that compensate for damage and inconvenience. In some cases, these payments exceed the appraised value of the structure in question. In other cases, the operator may have paid the minimum possible, or legal issues may have resulted in delays. In some cases, the operator may deny responsibility.
Using a geographic information system (GIS), this study investigated the relationship of property values to mining, looking specifically at assessed values and at sales of surface properties over a ten-year period. This period corresponds with the availability of data. Where available, data such as county tax assessment files that predate this time span were used as well. Maps of longwall panel development over time and maps of areas mined using room-and-pillar techniques were used to assess the effects on surface properties. Areas where no mining has occurred were used for control, and areas where longwall mining has been announced but has not occurred were studied.
Data for the geographic analysis (GIS coverage) for Greene and Washington Counties include:
► Boundaries of longwall permit areas
► Outlines of all longwall panels and dates of completion
► Boundaries of sewer delivery districts
► Boundaries of water delivery districts
► Center lines of paved roads
► Outlines of all tax maps (1:400 scale tax assessment property maps)
► Addresses of all properties receiving damage compensation from coal companies
► Location of all subsidence insurance claims on file with the DEP Mine Subsidence Insurance program
► Location of all reported subsidence incidents handled by the U.S. Office of Surface Mining and Reclamation
► Boundaries of all closed, abandoned, or depleted mines
► Boundaries of all surface parcels in Greene County
► Digital assessment records for both counties (geocoded to tax maps)
This report is intended to serve as a baseline to analyze property value changes in Greene and Washington Counties. Follow-up research to this report would be a traditional assessment on areas of the counties addressed herein. Such follow-up would serve two purposes: first, as a field verification for the GIS approach used in the study that produced this report, and second, as a test case for improving efficiency of traditional assessment by targeting predefined areas of a county.
Coal remains an essential part of today’s energy production in the United States. More than 90% of the nation’s coal is used to generate electricity. Nationwide, the electric utilities generate 51.4% of all electricity from burning coal (Freme, 2000). All other fuel sources – petroleum, natural gas, nuclear, hydro, wind, solar, and geothermal, combined – generate the remaining 48.6% of electricity used in the residential, commercial, and industrial sectors of the United States. In Pennsylvania, the percentage of electricity generated from coal is even higher – approximately 60%. In 1999, Pennsylvania’s electric utilities produced 96,023,410,000 kilowatt hours of electricity that powered 5,104,483 consumers in the state. Among the consumers, approximately 43% were residential, 26% commercial, and 30% industrial (Energy Information Administration, October 2000).
Although a few room and pillar deep mining operations still are producing coal the primary underground coal mining in Greene and Washington Counties in southwestern Pennsylvania uses the deep-mining technique known as longwall mining. This technique was first developed and extensively used in European coal fields. Introduced into Pennsylvania in 1967, longwall mining has grown in use as the larger coal mining companies apply this more efficient and productive coal extraction technique. Coupled with the highly efficient production rate is simultaneous and ongoing surface subsidence that conflicts with existing surface usage. While the subsidence movements and effects on the surface can largely be predicted, conflicts arise when surface features and structures are involved. While most of the large longwall operations to date have occurred in sparsely populated areas, some recent mine operations, particularly in Washington County, have occurred under populated areas and major roadways.
Extracting coal from tens to hundreds of feet below the surface produces the potential for surface subsidence, regardless of the mining technique used. Mining technique, however, can offer insight into the time frame when subsidence may occur. In room-and-pillar mining, subsidence can occur 30 years or more after a mine is closed – and often abandoned, whereas in longwall mining, subsidence occurs concurrently with mining and in certain circumstances can continue for almost two years. In contrast to room-and-pillar, longwall mining offers government and homeowners the benefit of having an active mine operator on the scene to repair damages.
Wherever rock or mineral is removed from underground, the void created will translate through the overlying bedrock and surficial material. The extent and control of surface movement depends on several factors, including the thickness of the mined coal, the mine geometry and mining methods, and the thickness, rock type (lithology), structure, and hydrology of the overburden (Dunrud, 1984). Much research has been done over the past 30 years in subsidence prediction and mitigation and is discussed in Section 2.3.
The political boundaries of Greene and Washington Counties encompass one of the nation’s most renowned coal seams, the Pittsburgh seam. The Pittsburgh coal seam is a single, persistent bed, with an almost horizontal structure and a thickness of four to ten feet (average six feet) across the two counties. The thickness of the overburden above the seven active longwall mines in the two counties ranges from 380 to 1,150 feet (Fiscor, 2001). The seam’s structure makes it ideal for mining using the longwall technique, and the coal’s lower sulfur content – typically less than two percent in these counties – makes it environmentally and technically desirable for a multitude of uses (Shultz, 1999).
Mining in the Pittsburgh seam began in Greene and Washington Counties more than a century ago where the coal outcropped along the Monongahela River and its tributaries. Despite the extensive mining of the past, the bulk of Pennsylvania coal at present – more than 80 percent – is mined from the Pittsburgh seam. Of the coal mined today, 99 percent of Pittsburgh seam coal is mined in Greene and Washington Counties. Deep mining also occurs in the Sewickley coal seam in southeastern Greene County, but it is minor by comparison (Table 2.2-1).
Table 2.2-1. Coal Production in Bituminous Deep Mines (2000) |
||||||
Coal Seam |
Greene County |
Washington County |
Pennsylvania |
|||
|
Tonnage |
% of PA Total |
Tonnage |
% of PA Total |
Tonnage |
% of PA Total |
Sewickley |
277,872 |
0.48% |
0 |
0.00% |
277,872 |
0.48% |
Pittsburgh |
37,506,037 |
64.18% |
9,283,762 |
15.89% |
47,256,740 |
80.87% |
Other Bituminous |
0 |
0.00% |
0 |
0.00% |
10,903,791 |
18.66% |
Total |
37,783,909 |
64.66% |
9,283,762 |
15.89% |
58,438,403 |
100.00% |
Source: Pennsylvania Department of Environmental Protection, 1999 Annual Report on Mining Activities in the Commonwealth of Pennsylvania, revised June 2000. |
||||||
The methods used for deep mining include conventional room-and-pillar, continuous mining room-and-pillar (with or without retreat mining), and longwall mining. With room-and-pillar mining, there is the possibility of leaving pillars of coal to support overlying structures, but in retreat mining, most pillars are removed. Room-and-pillar mining with retreat removes 80% to 90% of the coal. With longwall mining, continuous mining machines are used to set up the work areas for 1,000-foot-wide panels of coal that extend 10,000 feet or more in length. Within these panels longwall machines have the potential for removing 100% of the coal.
Since the introduction of longwall mining into southwestern Pennsylvania (Gateway Mine) and northern West Virginia in 1970, significant research has been completed to measure and predict the effects of subsidence on surface features and structures. Because longwall mining is designed to remove large blocks of coal completely and leave no coal behind to support the surface, longwall mining results in larger areas of subsidence troughs than conventional room-and-pillar mining. A typical panel of 1,000 feet wide and 10,000 feet long with six feet of coal could affect a surface area of almost 230 acres. Mining of the panel would remove almost 2.5 million tons of coal. Maximum vertical subsidence would occur on the surface along the centerline of this panel and could be in excess of three feet depending on the depth to the coal seam, the rock over the coal seam, and the surface topographic features.
Surface subsidence resulting from longwall coal mining of the Pittsburgh coal seam in Greene and Washington counties, Pennsylvania is affected by various geologic and engineering factors including:
► Thickness of rock over the coal seam (overburden)
► Thickness of the coal seam removed (excavated height)
► Type of rock (lithology) comprising the overburden
► Topography of the surface (surface relief, or variation in elevation and characteristics of land above the coal seam)
► Width of the longwall panel
► Location of the subsided surface in relation to the center and edges of the longwall panel
While all types of subsidence can cause damage to surface features and structures (houses, roads, etc.), the type and severity of damage depends on the forces (stress) that propagate to the surface as the mine roof collapses. These forces may include stretching (tension), squeezing together (compression), and sinking of the ground (vertical displacement). The effects of the forces are measured and studied by developing a subsidence profile, which shows how subsidence would look on a cross-section usually drawn at a right angle to the longwall machine as it moves lengthwise into the panel. The position of a surface structure in relationship to the underlying panel is critical to the severity of damage experienced at the surface.
According to Walker and LaScola (1989):
“It is widely recognized that the vertical displacement associated with subsidence causes little appreciable damage to structures, so long as the magnitude of the movement is uniform across the length of the structure. The most commonly observed damage is caused by the horizontal tensile and compressive strains associated with the bending of the ground. In subsidence engineering, bending of the ground surface is discussed in terms of inclination or tilt, and curvature. When analyzing the stresses on a structure caused by mining, it is necessary to address the stress caused by both the advancing subsidence wave and the development of the subsidence profile.”
Generally, the greatest amount of vertical displacement will occur along the lengthwise centerline of a longwall panel. The U.S. Bureau of Mines observed this phenomenon in a detailed study of longwall mining in the Pittsburgh coal seam in Greene County, Pennsylvania. The seam was 5.5 to 6.0 feet thick and 350 to 900 feet below the surface. It was mined in a 600-foot wide panel. Average subsidence varied from 3.25 feet (3 feet 3 inches) at the center of the panel to 0.41 feet (less than 5 inches) at the edge of the panel. At a distance of 150 feet away from the panel, vertical displacement was 0.05 feet (about one-half inch). Of the 16 monitoring sites used in the Bureau of Mines study, the most pronounced subsidence (4.04 feet) occurred at the center of the widest and shallowest panel (Adamek, V., Jeran, P. W., and Trevits, M. A., 1987).
According to the authors, “structural damage is determined by the extent of the surface deformations...,” which can be measured and predicted using calculations of the following:
1. Differential subsidence (inclination or tilt). This is the vertical distance between two points divided by their horizontal distance apart.
2. Curvature (differential inclination or slope). This is a measure of how the slope or inclination changes by curving or bending of the surface as one moves from the center of a subsidence trough to its edge.
3. Horizontal strains – tension and compression (differential horizontal displacements). Tension causes a lengthening and compression a shortening displacement measured in a horizontal plane. Tension tends to create cracks and compression tends to create bulges in the earth’s surface.
The mechanics of subsidence prediction and analysis are very technical and require engineering and advanced mathematical skills. The reader is referred to the Subsidence Engineers Handbook (National Coal Board, 1975) for additional information.
 Exhibit 2.3-1 Subsidence Profiles over Longwall Panel (Adamek et al., 1987)
Exhibit 2.3-1 shows an example from the Bureau of Mines study of subsidence and inclination over a 600-foot-wide longwall panel with overburden varying from 700 feet at the center of the panel to 650 feet at the one edge of the panel. At the center of the panel, a maximum subsidence of 3.25 feet was measured with no measurable change in slope. Subsidence (vertical displacement) decreased from the center of the panel to the edges. Inclination or curvature reached maximum levels at the approximate midpoints between the centerline and the panel edges. (Note that inclination was measured in millimeters per meter; one inch equals 25.4 millimeters, and one meter is 3.28 feet or about a yard. Using these conversions, the maximum inclination in this study was less than one inch per yard.)
The study also examined the horizontal displacement created by the subsidence event. Given that the ground sinks from less than an inch at the panel’s edges to 3.25 feet at its centerline, the surface experienced measurable horizontal movement. Exhibit 2.3-2 shows the horizontal displacements observed at the site. Maximum movement was less than 8 inches.
 Figure 2.3-2 Horizontal Displacements over Longwall Panel (Adamek et al., 1987)
In summary, the Bureau of Mines study found subsidence along the lengthwise centerline of longwall panels to be a vertical phenomena (3.25 feet on one panel) with no measurable horizontal displacement. At approximate midpoints between the centerline and the panel edges, horizontal displacement was found at its maximum (less than 8 inches for one panel). Surface features and structures above a longwall panel will experience varying levels of stress and subsequent deformation depending on specific location above the panel. Subsidence and deformation depend on:
► Vertical displacement
► Horizontal tension (stretching of the surface)
► Horizontal compression (squeezing of the surface)
Another study by the Bureau of Mines (Fejes, 1986) found that subsidence over 450- to 500-foot wide panels at depths of 800 to 1,500 feet with extraction of 5.9 feet of coal resulted in subsidence at the center of the panel of 1.7 to 2.2 feet (width/depth ratios of 0.4-0.5). Surface deformation was found to continue beyond the panel edge and sometimes resulted in a raising of the surface. According to this study, some subsidence occurred more than a year after the initial subsidence when the panel was mined. The Bureau researchers believe that mining an adjacent panel stimulated the continued subsidence over the mined-out panel for more than 19 months after mining ended. Ground stress associated with the differential subsidence resulted in horizontal movement and damage to surface structures.
The Bureau of Mines also studied a Greene County longwall panel and its related subsidence to learn how subsidence affects well water quantity and quality (Moebs & Barton,1985). Overburden at this site was between 750 and 1,000 feet; the coal removed was approximately 5.5 feet thick. In addition to maximum vertical displacement along the centerline of the panel, the study found:
► An initial subsidence of one-half foot occurred as the longwall face moved beneath the measuring instruments at the surface.
► Subsidence continued at a rate of approximately one-half foot per month until vertical displacement reached a maximum of 3.25 feet at the centerline seven months after undermining.
► Water wells only within the boundaries of the longwall panel showed a precipitous decline as a result of undermining. Water levels were unaffected in wells 500 feet or more beyond the panel boundaries. No evidence was detected of adverse effects on the small streams or springs located within 1,200 feet of the panel.
Another Bureau of Mines analysis (Jeran and Barton, 1985) found that subsidence deformation increases significantly as longwall panel width increases in proportion to coal seam depth. The researchers set up three categories to describe the three conditions of relationship between width and depth, as follows:
► Sub-critical: the panel width is less than the depth of the panel from the surface (for example, a panel is 600 feet wide and 1,000 feet deep).
► Critical: the panel width equals depth from the surface (for example, width and depth are both 1,000 feet).
► Super-critical: the panel width is greater than panel depth (for example, panel width is 600 feet and depth is 500 feet below the surface).
The researchers found that longwall panels wider than their depth (Super-Critical Condition) displayed complex horizontal and vertical surface movements and significant strain on surface features. They concluded:
“The super-critical geometry results in a subsidence curve [cross-section profile] with multiple points of maximum subsidence. The critical case has one point of maximum subsidence. The sub-critical case has a maximum point at its center, but this is less than the maximum possible subsidence.”
In a fifth report from the U.S. Bureau of Mines research, Jeran and Adamek (1988) observed that in the rolling hilly terrain of Greene County, the hillsides were showing significantly more subsidence effects than the valleys. The magnitude and direction of horizontal deformation were increased on hill slopes by soil and rock slumping and moving downslope. These downslope slumps may represent a geologic phenomenon of mass movement where the surface is adjusting to changes in the slope induced by subsidence.
Another Bureau of Mines study completed by Ingram (1989) showed that both the horizontal and the vertical forces of tension and compression move in a wavelike motion along the surface slightly ahead of the advancing longwall face. Exhibits 2.3-3 and 2.3-4, provide a schematic of this process. Exhibit 2.3-3 depicts how the surface is subjected to waves of stretching (tension) and squeezing (compression) as the longwall face passes. The advancing wave creates a tensional force and then changes to a compressional force.
 Exhibit 2.3-3 Compression and Tension from Movement of Panel Face (Ingram,
1989); Profile Parallel To the Panel
Exhibit 2.3-3 Compression and Tension from Movement of Panel Face (Ingram,
1989); Profile Parallel To the Panel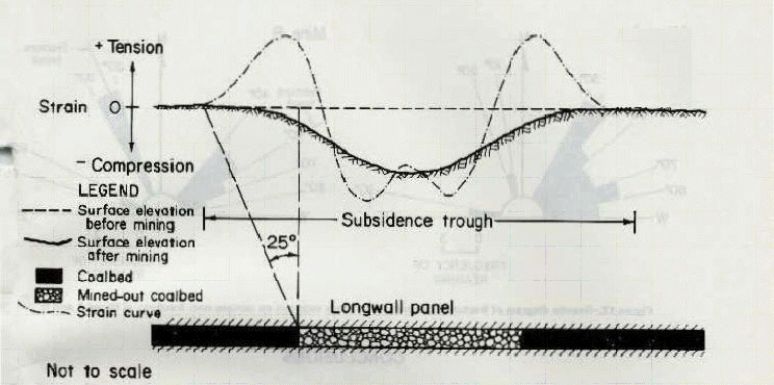 Exhibit 2.3-4 Compression and Tension over Subsidence Trough (Ingram, 1989);
Profile perpendicular to Panel
Exhibit 2.3-4 shows the tensional and compressive wave as the surface subsides over the panel. In a super-critical situation, this wave becomes a complex of overlapping stresses of tension and compression as well as multiple subsidence troughs. Thus, in addition to the vertical and horizontal displacement discussed in earlier Bureau of Mines studies, Ingram identified a different kind of upward movement of the earth’s surface in relation to the wave.
The Bureau of Mines study reported by Walker and LaScola (1989) used four concrete walls to examine the effect on surface structures of vertical and horizontal movement caused by subsidence. The study examined the stress and damage created by a 1,000-foot-wide longwall panel, mining 6 feet of coal below 650 feet of overburden. Three “static” 36 feet long by 4.66 feet high walls (labeled B – midway between centerline and panel edge; C – between B and the panel edge; and D – near panel edge) were placed parallel to the longwall face over the panel at specified distances from the centerline of the panel. A fourth “dynamic” wall, A (86.33 feet long by 4.0 feet high), was placed perpendicular to the longwall face along the centerline of the panel.
After undermining, all four walls were deformed, but none of the three static walls were cracked. Of the static walls, wall B was located across the predicted maximum compression point, and wall D was located across the predicted maximum point of tension; these walls showed the most curvature. Because of location, these walls were subjected to the highest amount of tension and compression resulting from horizontal ground movement. Wall A, which was longer and located parallel to the direction of mining, was cracked into three pieces as the longwall face passed underneath, primarily in response to tensional forces.
The researchers concluded that structures tend to respond to the stresses caused by undermining in a similar manner as the ground. However, the structures respond at varying rates and times. The variations as well as the rigidity of the structures resulted in deformation and damage.
Subsidence research had been performed by the former U.S. Bureau of Mines and various contractors (including Resource Technologies Corporation) for the Bureau of Mines prior to the opening of the Bailey Mine in Richhill Township, Greene County. Some of this published research involved the Pittsburgh coal seam in Greene County, PA, in southwestern Pennsylvania, in general, and in West Virginia.
As early as 1975 Stingelin et al. used the principles of subsidence prediction, as developed in Europe, to modify and apply to U.S. geological conditions. Developed for the anthracite region of northeastern Pennsylvania, the resulting prediction methodology was also tested successfully in the Bituminous coal fields of Pennsylvania and western Maryland. This simplified model gives a prediction of maximum subsidence expected along the centerline of a panel.
Since this and other earlier attempts at mine subsidence prediction, the Bureau of Mines, OSMRE, and university researchers, as shown by the cited selected research publications, have advanced the state-of-the-art in subsidence prediction over longwall panels and in understanding of the nature of the underlying forces. Recent research studies have concentrated on protecting surface structures during a subsidence event. Such principles as the plane-fitting technique have proven to be effective in mitigating the effects of the bending and twisting actions associated with ground subsidence (Peng and Yi Luo, 1994).
Continued research into longwall mining’s effects on the surface features and structures is ongoing by government and university researchers. In a 10-county study area in western Pennsylvania (PADEP, 1999, 2001 – Act 54 reports), the effects of both longwall and room-and-pillar mining on surface structures and features and water resources were studied. Of 15 perennial streams undermined by longwall panels, 9 exhibited pooling conditions, 4 exhibited diminished flow, and 2 exhibited both pooling and diminution. Additional research has been completed and can be seen in the report on streams, wetlands, and riparian areas.
Longwall panel dimensions continue to increase. Since the original Gateway Mine panel configuration in 1970 (460 feet wide and 6,150 feet long), panels have increased dramatically in their dimensions. Currently, panels in the Bailey Mine are 1,100 feet x 10,500 feet. Planned panel dimensions at the New Century Mine in Fallowfield Township, Washington County, Pennsylvania are 850 x 12,500 feet. These increases in panel dimensions raise the fear for potentially increasing surface damage, particularly in more densely populated areas.
In summary, longwall panel width and depth are critical to what happens at the surface. With panel width increasing beyond overburden thickness (depth to the coal seam), super-critical conditions are established. Thus, more extensive surface areas are exposed to potential deformation, and maximum subsidence is more likely to occur at multiple points across a panel. Super-critical conditions with respect to panel width and depth have the potential to increase the extent and severity of surface damage. In contrast, making panel longer will have no effect on the severity of surface subsidence events. Longer panels will increase mine efficiency and economics.
2.4 Pittsburgh Coalbed – A Geologic Description
The Pittsburgh coalbed was deposited over a period of several million years during the geologic time period known as the late Pennsylvanian, which ended about 286 million years ago. The coalbed was formed in a large basin that included all of Greene County and much of Washington County. It is the most extensive and economically important coalbed in the region. The basin axis passed through Washington and Greene Counties and a calcareous, or limey, shale was generally deposited over the coal-forming swamp. Clastic deltaic deposits (sand, silt, and mud) were introduced from the southeast and northwest. The deposits created a roof above the Pittsburgh coal that is most commonly alternating thinly bedded, dark gray to black, fissile, carbonaceous shale, coal stringers, and sandstone lenses, often called “draw slate.” The draw slate is generally less than 4 feet thick (McCulloch et al, 1975).
The rock layers above the coal and draw slate (overburden) are predominantly interbedded limestone, shale, and siltstone. Sandstone is generally present in eastern areas, manifesting itself as channel sandstone and as sandstone cutouts of the coal seam. The rock type (lithology) of the overburden plays an important role in the severity of surface subsidence, particularly in Washington County where thickness of the overburden is less than that encountered southwestward as the Pittsburgh seam plunges deeper along a synclinal axis (USGS OFR 97-864).
The Pittsburgh coal, although variable in thickness, maintains a persistent four to eight foot minable thickness throughout the area and is most commonly five to six feet thick. The coal generally thickens southward where it reaches a maximum of 16 feet or more in southeastern Greene County. The coal generally occurs as a main seam and roof coal with a shale (draw slate) parting.
Quality is an important factor of the Pittsburgh seam. The Pittsburgh coal has shown the following ranges in chemical analyses (Keystone Coal Industry Manual -1982, p. 6l4, for Greene County (dry-ash free basis):
Sulfur 0.8-3.2% |
Ash 4.2-10.8% |
Btu/lb 13,040-14,140 |
Moisture 1.7-3.7% |
Volatile Matter 33.0-36.4% |
Fixed Carbon 52.2-57.3% |
Ash Fusion Temp 2,110-2,620F |
|
The Pittsburgh coal has a market for steam generation used in powering electricity-producing turbines. Where the sulfur content is below 1.5 percent (washed), the coal meets metallurgical specifications for sulfur (1.3-1.4%), ash (5.0-6.0%), and free swelling index (7.5-8.0). Because of the decrease in demand for metallurgical coal, much of this metallurgical reserve will eventually be used as steam coal. Most of the metallurgical-grade reserves are in the eastern areas of Washington and Greene Counties where they were heavily exploited in the past by room-and-pillar deep mining.
2.5 Status of Longwall Mining in Southwestern Pennsylvania
Current Pittsburgh seam longwall mining status in Washington and Greene Counties, PA as reported in Coal Age (2002) is summarized in Table 2.5-1. This includes the Blacksville No. 2 Mine that has its entry in West Virginia but is mining predominantly in Greene County, Pennsylvania. Mon-View Mining’s Mathies mine was shut in early 2002. Maple Creek Mine and Dilworth Mine are scheduled for closings in late 2002, and the High Quality Mine is scheduled to initiate operations in 2003
In addition to these active longwall mines, longwall activity occurred in three additional mines now included in the mined-out areas on the accompanying exhibits of current and past mining activity in Greene and Washington Counties, Pennsylvania. These mines are Blacksville No. 1, Humphrey No. 7, and Gateway. The location and permitted extent of these mines are shown in Exhibit 2.5-1, Exhibit 2.5-2 and Exhibit 2.5-3.
Table 2.5-1 Active Longwall Mines in Southwestern Pennsylvania (Pittsburgh Seam) |
|||||
Mine |
Seam (Inches) |
Cut Height (Inches) |
Panel Width (Feet) |
Panel Length (Feet) |
Overburden (Feet) |
Bailey 1 |
62-72 |
62-72 |
1,100 |
10,500 |
600 - 1,000 |
Bailey 2 |
62-72 |
62-72 |
1,000 |
9,000 |
600 -1,000 |
Blacksville No 2 |
78 |
74 |
1,000 |
10,000 |
850 - 1,150 |
Cumberland |
78-84 |
78-84 |
930 |
10,500 |
750 - 1,050 |
Dilworth |
76-80 |
76-80 |
1,020 |
5,000 |
500 - 800 |
Mine No. 84 |
90 |
68 |
1,100 |
9,000 |
500 - 750 |
Emerald No 1 |
72-84 |
72-84 |
984 |
9000 - 12000 |
380 - 950 |
Enlow Fork 1 |
68-72 |
68-72 |
1,000 |
9,000 |
600 - 1,000 |
Enlow Fork 2 |
68-72 |
68-72 |
1,000 |
9,000 |
600 - 1,000 |
Maple Creek |
67 |
67 |
850 |
5,000 |
400 - 500 |
High Quality |
62 |
62 |
850 |
12,500 |
400 - 600 |
 Exhibit 2.5-1 Current Longwall (red or gray panels) and Past Pittsburgh Seam
Mining (Blue) in Greene and Washington Counties
Exhibit 2.5-1 Current Longwall (red or gray panels) and Past Pittsburgh Seam
Mining (Blue) in Greene and Washington CountiesA larger scale map of longwall and past room-and-pillar mines in Greene County is shown in Exhibit 2.5-2. This is followed by a similar map for Washington County (Exhibit 2.5-3).
 Exhibit 2.5-2 Current Longwall (red or gray panels) and Past Pittsburgh
Seam Mining (blue) in Greene County, Pennsylvania
Exhibit 2.5-2 Current Longwall (red or gray panels) and Past Pittsburgh
Seam Mining (blue) in Greene County, Pennsylvania
 Exhibit 2.5-3: Current Mining Permits (red), Longwall Panels (blue), and
past Pittsburgh Seam Mining (light blue) in Washington County,
Pennsylvania.
Exhibit 2.5-3: Current Mining Permits (red), Longwall Panels (blue), and
past Pittsburgh Seam Mining (light blue) in Washington County,
Pennsylvania.
The data used to complete this study came from a variety of sources:
► PADEP Act 54 database (8/94-8/98)
► PADEP claims database (McMurray)
► PADEP Mine Subsidence Insurance database (Harrisburg)
► PADEP six-month mine map repository & database
► OSMRE mine map repository (abandoned mine lands)
► OSMRE database on subsidence mitigation
► Consol Energy database on damage claims & payments/repairs
► RAG database on damage claims & payments/repairs
► PA Coal Association data & library resources
► Tri-State Citizens Mining Network (headquartered in Washington County)
► County tax assessment databases (re: changes in assessment values)
► County tax assessment databases (re: tax revenue from coal mining)
► County recorders of deeds databases (re: property sales information over study period)
► Historic records of national property value trends over time (inflation)
► Anecdotal records from media sources
► RTC GIS database on mining activity
The most important data considered for both Washington and Greene Counties is listed below:
• Current and historical mining maps for insertion into a GIS
• Coal company data pertaining to property settlements
• Parcel and tax index maps
• Tax roll information for the last 10 years
• Maps of infrastructure such as sewer and water
• PADEP subsidence claims database
• OSMRE emergency subsidence claims
Resource Technologies Corporation (RTC) has developed and maintains a geographic information system (GIS) identifying mining activity in Washington and Greene Counties. RTC has maps of mined-out longwall panels, mined-out room-and-pillar mines, previous surface and deep mining, and current active mining permits. Much of these data are derived for DEP and coal company maps. The database associated with the mines contains information such as date of mining, size of the mine, volume of coal, and production history.
To learn whether homeowners are being compensated for damages due to longwall mining, RTC sought and obtained coal company data on settlements. These data were aggregated to a tax index map scale to protect privacy and maintain confidentiality.
A GIS is a computer-based system that allows for simultaneous analysis of many layers of map data, such as the relationship of underground mining to overlying surface property. In addition, a GIS permits analysis of associated tabular data, such as county assessment information with map data. Using a GIS system to relate property information to mining information is relatively easy. Essential to the process is the conversion of all data to the same map base and relational database structure. RTC completed the conversion of all county assessment records, mine maps, and tax index maps as part of the contract with DEP to perform this study. With the exception of the coal company compensation records, the maps and record bases are now part of the public record.
The pertinent aspects of the coal company compensation records were made available to this project under a confidentiality agreement. The agreement stipulated that the data could be used only in an aggregated form (tax map location rather than specific address). This procedure was necessary to satisfy the confidentiality requirements contained in various agreements between the coal companies and various surface owners. In Washington County, the tax index maps were digitized from paper base maps. In Greene County, a digital version of tax index maps was created by aggregating individual parcels into tax map groupings. In both counties, historic tax assessment change records had to be reconstructed from the annual data stored digitally on computer tapes.

Although this project is based on the scale of tax index maps, it was desirable to use individual parcel maps during the analysis phase of the project. The greater detail of parcel location leads to greater accuracy using the GIS approach. For example, the parcel map was laid on the mining map to identify which properties could potentially be affected by longwall mining. Exhibit 3-1 shows how surface maps were assigned to the longwall panels. Properties whose major portions did not overlie a panel were not identified as longwall properties
The parcel map for Greene County was acquired from the county. This permitted RTC to identify individual properties that could be affected by longwall mining. However, in Washington County, only the tax index maps were available. RTC had to consider that every property in an index map containing longwall mining could be affected by the mining, even though only a small portion of the index map may have a longwall panel in it. This is because the locations of the individual properties within the index map are not known.
Tax roll information was obtained from both counties over a period of about 10 years. This information was used to track whether property values changed from year to year, and if longwall mining influenced these changes. In Washington County, 12 years worth of tax data, from 1991-2002 were available. In Greene County, only 1993-1997, 2000, and 2001 were available. Data was interpolated between 1997 and 2000.
The methods of using these data are described in the sections below.
4.0 SALE AND COUNTY VALUE OF LONGWALL AND NON-LONGWALL PROPERTIES
Differences in property value based on proximity to longwall mining were analyzed for this study. Properties above longwall mining were compared to similar properties not affected by longwall mining. Comparing sales data and county value data, RTC found no statistically significant correlation between the presence of longwall mining and general or average property values. Other factors such as access to infrastructure such as public sewer and water, remoteness of site (land use density), and proximity to a roadway have more pronounced relationships to value than proximity to mining.
4.2 Sale and County Value Comparisons
The following objective from the Project Work Statement was addressed:
Using areas of appropriate size and composition, obtain and compare the fair market values of surface properties above longwall mines and the fair market values of surface properties in control areas to determine if there is a statistically significant difference between the two groups.
In addressing this objective, RTC realized that the available data sets would not allow an analysis of “fair market” value in the strict sense of the word. As used in the appraisal industry, fair market value is defined as an estimate of current monetary value of a property, including all tangible and intangible assets, assuming that a willing and competent buyer, with full knowledge of all pertinent characteristics and possible uses of the asset, without undue pressure or duress to motivate the purchase, would purchase the asset from a willing and competent seller, who also possesses full knowledge of all pertinent characteristics and uses and, without undue pressure or duress to motivate the sale of the asset, would sell the property.
To solve the dilemma of assigning value for the analyses, RTC converted the county assessed values of all relevant properties to an estimated market value, and named the resulting estimate the “county value.” The county value was calculated by dividing the assessed value from the county records by the county’s common level ratio. Common level ratio is a number calculated by the state Department of Revenue and used to make sure Pennsylvania’s property transfer taxes are equitable across the state. Each county in the state has a common level ratio calculated annually on the basis of property sales in that county. By dividing assessed value by the common level ratio, an estimate of market value can be calculated. This county value estimate may be different from the fair market value a willing buyer will pay a willing seller for a property.
Therefore, analyses for Sections 4 and 5 of this report use the calculated county value, which is an estimate of market value and may not be the same as actual fair market value.
Control groups of properties in areas where no longwall mining had occurred were identified within each county. The control groups were used to compare properties with similar characteristics, such as house size, access to roads, access to public sewer and water, to see whether differences in county value could be attributed solely to longwall mining. Five longwall and five control non-longwall groups of properties were selected for the study.
4.2.2 Control Area Selection Methodology
The following methodology was used to select mine areas and associated control areas for study:
1. Longwall mine study areas were selected from current mine maps. Maps were obtained from the DEP and confirmed with mining companies. Mine maps were registered to the Greene County and Washington County map base. All panels were digitized into the GIS system and the panel completion dates were included in the tabulated data attached to each mapped panel (Exhibit 4.2.2-1).
2. Abandoned and closed conventional underground mine areas were mapped. Each mined area was identified by mine, operator name, and type of mining.
3. Proposed mining areas were identified from existing mine plans obtained from DEP and the longwall mining companies.
4. Basic coal geology was mapped. Geologic information was limited to depth and seam thickness.
 Exhibit 4.2.2-1 A Portion of the Study Area Showing Longwall Panels and Completion Dates
(black), Abandoned Mine (orange crosshatch), Permitted Mining (red), Greene County Parcels
(green), and Washington County Tax Index Maps (blue).
Exhibit 4.2.2-1 A Portion of the Study Area Showing Longwall Panels and Completion Dates
(black), Abandoned Mine (orange crosshatch), Permitted Mining (red), Greene County Parcels
(green), and Washington County Tax Index Maps (blue).5. All property tax parcels in Greene County were mapped. The data file attached to each mapped parcel includes current assessed value, size, extent of structural improvements, sale price, deed number, last known transfer, owner name, location address, access to utilities, appeals history.
6. Digital versions of Washington County’s paper tax index maps were created in the GIS, but digital maps of individual property tax parcels were not created.
 Exhibit 4.2.2-2 Base Map of County Tax Index Maps (black) and Township
Boundaries (blue)
Exhibit 4.2.2-2 Base Map of County Tax Index Maps (black) and Township
Boundaries (blue)Records in the county’s tax assessment database were associated with the appropriate tax index map. The average Washington County tax index area represents 350 acres, although some encompass as few as 10 acres and a couple as many as 1,200 acres. In Greene County, the average tax index map is 1,500 acres, the maximum is 5,000 acres, and the minimum is 1 acre. On average, a property located by tax index map is estimated to be within 1,500 feet of its real map location. The Washington County data included similar attributes as the Greene County data files, such as current assessed value, size, extent of structural improvements, sale price, deed number, last known transfer, owner name, location address, access to utilities, appeals history..
 Exhibit 4.2.2-4
 Exhibit 4.2.2-3
7. A base map of all tax index maps (combining Greene and Washington Counties) was created (Exhibit 4.2.2-2). The average size of each tax index area (called a map polygon) in the combined base map is 350 acres. The average map polygon contains 50 property tax parcels. In urban areas, the density is higher (more than 500 parcels per map polygon) and the map index areas are smaller (10 acres or less). No longwall panels are located under urban areas in either county. In rural and remote regions of the counties, the map polygons represent more land area (up to 1,750 acres) and fewer property tax parcels (less than 35). Longwall mines tend to be located in remote and rural areas of the counties. The distribution of sizes and density of property tax parcels are shown in Exhibit 4.2.2-3 and 4.2.2-4.
8. Areas with public sewer and water were digitally mapped using county supplied maps (an example is shown in Exhibit 4.2.2-5).
 Exhibit 4.2.2-5 A Portion of Greene County Showing
Areas with Public Sewer and Water (blue) and Sewer
Delivery Zones (red) over Tax Index Maps (black).
Exhibit 4.2.2-5 A Portion of Greene County Showing
Areas with Public Sewer and Water (blue) and Sewer
Delivery Zones (red) over Tax Index Maps (black).9. All state numbered highways were mapped. Each parcel and/or index map location that is within ½ mile of a road was attributed as such.
10. Areas (polygons) surrounding the longwall panels but within existing mine subsidence permits were analyzed to identify basic characteristics: depth to coal, density of surface development, public sewer and water delivery areas, road accessibility, and relationship to abandoned mining.
11. Control group areas where longwall mining has not occurred were selected to closely match the properties in longwall study areas. Each control area was selected to represent similar characteristics with each related longwall group, as follows:
• size (geographic area)
• land use (density of parcels and structures)
• historical mining
• access to infrastructure (length of public sewer and water lines, number of roads)
• surface characteristics, topography, density of streams
For both counties, all surface properties with their associated assessments, sales, and tax index maps were assigned to a control area, a mine area, or an “outside” area (neither control nor mine). All analyses and comparisons were performed on these consistent assignments. The control and mine areas were identified as Greene East, Greene Central, Greene West, Washington East, and Washington West (Exhibit 4.2.2-6) and are associated with the following longwall mining:
• Greene East: CONSOL Dilworth Mine
• Greene Central: RAG Emerald and Cumberland Mines
• Greene West: CONSOL Bailey and Enlow Fork Complex
• Washington East: Maple Creek, New Century, and 84 Mines
• Washington West: CONSOL Enlow Fork complex
12. The average density of land use (improved parcels per square mile) was
calculated from the GIS data. Using a natural break analysis, a grid of the study area (both counties) was developed. Density ranges for the grid were assigned as follows:
 Exhibit 4.2.2-6 Matched Analysis Study
Areas with Longwall Mining (Mine) and
Related Control Areas without Longwall
Mining
Exhibit 4.2.2-6 Matched Analysis Study
Areas with Longwall Mining (Mine) and
Related Control Areas without Longwall
Mining
• Remote (less than 50 improved parcels per square mile)
• Rural (less than 500 improved parcels per square mile)
• Suburban (less than 2,000 improved parcels per square mile)
• Urban (more than 2,000 improved parcels per square mile)
Exhibit 4.2.2-7 provides an overview of the tax index map density throughout two counties. Density was an important factor used to select the control (no-longwall) comparison areas. Table 4.2.2-1 counts the number of index map areas classified as remote, rural, or suburban by mine and control areas.
Sewer and water service delivery areas are shown in Exhibit 4.2.2-8. Table 4.2.2-2 counts the number of index map areas with and without public sewer and water services in the mine and control areas.
 Exhibit 4.2.2-7: Image of study area showing roads,
color grid of parcels per square mile, mining areas and
control areas.
Exhibit 4.2.2-7: Image of study area showing roads,
color grid of parcels per square mile, mining areas and
control areas.
Table 4.2.2-1: Land Use Density by Analysis Area |
||||
Analysis Control Area |
Count of Tax Maps Classified |
|||
Density |
Total |
|||
Remote |
Rural |
Suburban |
||
Control |
653 |
68 |
41 |
762 |
Mine |
500 |
63 |
43 |
606 |
Outside |
38 |
9 |
9 |
56 |
Total |
1191 |
140 |
93 |
1424 |
 Exhibit 4.2.2-8: Sewer and water delivery service areas
Table 4.2.2-2: Utilities by Analysis Area |
|||
Analysis Area |
Count of Tax Maps |
||
Utility Status |
Total |
||
None |
Public Services |
||
Control |
634 |
150 |
784 |
Mine |
427 |
157 |
584 |
Outside |
29 |
27 |
56 |
Total |
1090 |
334 |
1424 |
If proximity to longwall mining negatively affects property value and if properties are consistently assessed by the county assessment departments, then properties in longwall areas should be consistently assessed less than similar properties in the companion control areas. To test this hypothesis, the “county estimate of value” of all properties within each of the areas was aggregated to the tax index map level for each of three property types (residential, agricultural, and other [industrial/commercial]):
• building: average (mean) value and median value
• land: average (mean) value and median value
• total: average (mean) value and median value
Total value is estimated from the county assessed value by dividing the assessed value by the county common level ratio (a time adjusted or corrected version of the assessment rate). For example, if the assessed value of a property is $20,000 and the common level ratio for the county is 0.25, the calculated estimate of property value would be $80,000, which RTC calls the “county value” for the express purpose of comparison in this study. To compare properties, the unit value (or value per acre) was calculated for each parcel and for each index map area. The following examples illustrate the math:
Example |
A |
B |
C |
D |
E |
Assessed Value (as shown on County Records) |
Common Level (Assessment) Ratio |
Calculated County Value (A÷B) |
Size of Parcel: Acres (As shown in County Records) |
County Value/ Acre (C÷D) |
|
1 |
$20,000 |
.25 |
$80,000 |
0.5 |
$160,000 |
2 |
$30,000 |
.3 |
$100,000 |
0.75 |
$133,333 |
3 |
$100,000 |
.25 |
$400,000 |
4.0 |
$100,000 |
The Geographic attributes were assigned to each parcel and each tax index map as follows:
• Located in Control Area, Mine (longwall), or Other (Outside of Mine or Control)
• Access (2000 feet) to
• Public Sewer and Water
• Public Sewer and private water
• Public Water and private sewer
• No Public water or sewer
• Highway access (within ½ mile highway)
• Density (remote, rural, suburban, or urban)
• Size breakouts:
• Lots less than1 acre
• Less than 2 acres greater than 1 acre
• Less than 10 acres greater than 2 acres
• Less than 100 acres greater than 10 acres
• Greater than 100 acres
In order to focus on sites where mining affects could be statistically significant, the statistical analysis of “county value” is based on:
• Residential property as listed by the assessment office
• Improved parcels (parcels with buildings, where building value exceeds $1,000)
• Total value is more than $10,000 and less than $500,000
 Exhibit 4.3-1: Comparison of County Value
Exhibit 4.3-1 shows that the value as determined by the county of properties associated with longwall operations inconsistently varies from the county value of properties located in the control areas. The differences appears to relate to location. The data used in exhibit 4.3-1 includes 1,073 properties:
• 388 in the suburban setting (346 control, 42 longwall)
• 111 in the remote setting (60 control, 51 Longwall)
• 574 in the rural setting (326 Control, 248 Longwall)
These data show that:
• For the most part, longwall operations are not sub-adjacent to suburban development (suburban developers may avoid longwall areas, longwall operators may avoid suburban areas, coal is not minable or is depleted in the suburban areas).
• In remote areas improved residential properties are assessed at county values under $50,000 per acre including improvements
• In contrast, properties overlying longwall mines appear to carry a slightly higher valuation in the rural areas. The average improved residential parcel overlying a longwall operation is valued by the counties at less than $120,000 per acre (including improvements), while properties in the control areas are valued at around $85,000 per acre (including improvements).
• The variance is reversed in the suburban areas where improved residential properties in longwall areas show a lower average value (about $115,000) than properties in the control areas (about $159,000).
From this snapshot, no distinct correlations can be developed. A more detailed look at these data shows that, in general, county value per unit is dependent on size, density, infrastructure available, access to roads, and other improvements. The research shows that, in general suburban lots improved with sewer and water and near a highway generally sell for more per unit (per acre) than, remote acreage with no infrastructure. Urban parcels generally sell for the most per acre.
 Exhibit 4.3-2: Image of Study Area showing Roads and
Color Grid showing pattern of County Value / Acre for
Mining and related Control Groups.
Exhibit 4.3-2: Image of Study Area showing Roads and
Color Grid showing pattern of County Value / Acre for
Mining and related Control Groups.Exhibit 4.3-2 shows the pattern of county value per acre across both counties. The value pattern closely follows the density pattern for each county. Within the density areas (remote, rural, suburban, urban) variation in county value was larger between properties with services available (water/sewer/access) and services not available (on-site sewer and water) than any other variation value including the presence of longwall mining. Mining control areas were selected to closely match both density patterns and value patterns.
Access to public sewer and water are particularly important in Greene County and in much of Washington County. Private water wells typically cost more than $5,000 per home to complete. Many areas in both counties cannot qualify for conventional on-site septic systems because of natural soil conditions. According to the Greene County Planning Department, virtually none of the county qualifies for conventional on-site septic systems. Non-conventional septic systems can cost from $10,000 to $20,000 to construct.
The county assessment departments appear to relate property value per unit to access, sewer and water, lot size, extent of improvements, and adjacent land use (location and consistency as, for example: suburban development with similar lots and houses). These factors are consistent with residential appraisal experience. The data shows that if the presence of longwall mining affects property value as estimated by the county, it is less significant than the other factors. Those properties where the presence of longwall mining relates to county assessed value appears to be limited to properties that have participated in the assessment appeals process. But, as discussed in Section 5 of this report, 1) the relationship between appeal results and value is not consistent and 2) the relationship between appeal results and reassessment of a property is not consistently related to damages paid. As shown in the balance of this section, the relationship between assessed value and sale prices is not consistent and there appears to be little, if any relationship between presence of longwall mining and the divergence between sale price and county value.
 Exhibit 4.3-3: $/Acre with and without
Sewer and water.
Exhibit 4.3-3: $/Acre with and without
Sewer and water. Exhibit 4.3-4: $/Acre with and without Sewer
and Water.
Exhibit 4.3-4: $/Acre with and without Sewer
and Water.County value for residential property typically reflect access to sewer and water. As shown in Exhibit 4.3-3, sewer and water access significantly affects the assessed value of the sample 1,073 residential property throughout both counties. In the remote areas, the presence of sewer and water is negligible, but in both the rural and suburban areas sewer and water are a driving force in the valuation of the properties. Properties having access to sewer and water are valued significantly higher on a per unit basis than those not connected to public utilities. Substituting the median for the mean does not substantially change the graph.
Isolating utility access in the
data across all density regions (1,073
properties) shows that while sewer
and water are driving influences in the
counties’ assessment of value,
proximity to longwall operations
appears to affect the counties’
assessment of improved property
value. Exhibit 4.3-4 shows the
variation in per unit improved value
between properties
 Exhibit 4.3-5: $/Acre with available Utilities
compared to density.
Exhibit 4.3-5: $/Acre with available Utilities
compared to density.
with access to sewer and water and those having no access overlying longwall operations and properties in the control areas.
Because properties potentially affected by longwall mining are located in the rural areas of the two counties, Exhibits 4.3-5 and 4.3-6 address only the remote and rural areas. As shown in Exhibit 4.3-5 for all service types, properties classified as rural are valued significantly higher per unit then remote properties. In both cases, for all 658 properties in the sample, properties with sewer and water are valued higher than properties with no services or with only sewer or water.
 Exhibit 4.3-6: $Acre with available Utilities
compared area.
Exhibit 4.3-6: $Acre with available Utilities
compared area.Exhibit 4.3-6 divides the same properties between Longwall and control areas. Comparing the two charts, immediately shows the inconsistencies in the apparent correlations between county unit value and property attributes. In this Exhibit, in the control area the county values are higher for properties with only water than for properties with sewer and water (relationship is consistent using means and medians). What is evident is that in both longwall and control situations, sewer and water is an important determinate of value.
As shown in Exhibit 4.3-6, it would appear that 1) properties related to longwall operations with sewer-only and with sewer and water services are, on average, valued by the county assessment offices higher than control properties with similar attributes, while 2) control properties with no services and with water-only are valued higher than longwall properties with similar attributes.
 Exhibit 4.3-7: County Value with Public Sewer
and Water and within half a mile to a Road.
Exhibit 4.3-7: County Value with Public Sewer
and Water and within half a mile to a Road.The analysis shown in Exhibit 4.3-7 is limited to only those properties served by public sewer and water and within ½ mile of a secondary roadway. As shown in the Exhibit for these 156 properties there remains a slight difference in the county estimated value per acre for improved residential between Longwall and the Control area in the rural and the remote regions of the counties.
If longwall mining affects property value, then longwall properties should sell for less than similar properties in control areas. Comparing sales price to county value should show a consistent difference between longwall areas and control areas. In short, if longwall properties sell for less than non-longwall properties, then, in general the relationship of sale price to county value should be negative or lower for longwall properties and positive or higher for non-longwall properties. To test this hypothesis, sales of properties were mapped. All sales occurring after 1995 were analyzed for arms length (not to family) and validity – State Tax Equalization Board (STEB) files were matched to the county parcel sales data.
Only sales considered valid by STEB were included in the analysis (of the 57,000 transactions noted only 15,529 were considered valid; of those:
• 13,161 occurred in Washington County
• 2,168 were located in Greene County
Validity checks included:
• sales for reasonable price (at least 25% of assessed value)
• seller and buyer not related (last names different)
• not a forced sale (sheriff’s sale, bankruptcy sale, or court-ordered sale)
• not the settlement of an estate
• value over $1,000
In addition, for this project the transaction could not be a purchase or a sale by the major coal operators or their assigns. (Removal of coal company sales was undertaken because the coal companies have purchased properties for significantly more than county value for typical residential properties in order to expeditiously settle claims, to preempt claims, or to purchase specific locations for air shafts or other surface features necessary for mining.) The GIS attributes were assigned to each sale. Of all valid sales, 2,933 properties sold for less than the county value, and 12,596 sold for more than the county value (Exhibit 4.4-1).
It must be emphasized that the county assessment value is an estimate of value based on research completed at a specific period in time. The base year values used by both counties are more than 10 years old. The assessed values are converted to county value by applying the common level ratio for a given year. The common level ratio is developed by the State Tax Equalization Board (STEB) annually to evaluate the equity and quality of the county assessment procedures. The common level ratio is based on the ratio of sale to assessed value.

Exhibit 4.4-1 Sales in Greene and Washington Counties Where Sale Price Was Less Than County Value (pink triangles)
and Where Sale Price Was Greater Than County Value (blue triangles)Regardless of the accuracy or currency of the counties’ assessment of value (county value) , for this study a comparison of sales price to assessed value provides a useful tool to establish trends in the market. The GIS system permits the geographic analysis of trends. If a property sells for less than a county’s estimate, then the ratio is negative. If a property sells for more than a county’s estimate, then the ratio is positive. If proximity to longwall negatively affects the value and the marketability of a property, then a higher proportion of negative ratio properties should be found in the longwall areas than elsewhere in the county or within the control areas.
Because both counties were last assessed more than 10 years prior to this study, one could expect to see sale prices consistently higher than county value. For the most part, this difference in sale to county value has been consistent over the last 7 years. Approximately 72% of the sales captured in this analysis were sold for more than the county estimated value and 18% were sold for less than the county estimated value.
Since virtually none of the sales sold for the exact county estimate of value (one would not expect sales to be consummated for the exact county estimate), the analysis is based on distance or percentage away from the county estimate. For example, one could consider any sale within +/-10% of the county estimate to have sold for the estimated value.
Exhibit 4.4-2 Pie Charts Showing Divergence of Sale Value from County Value provides an overview by analysis classes.
As shown on the charts, properties associated with:
• Active Longwall mines were sold below the county value 14.8% of the time.
• Closed Longwall mines were sold below the county value 16.6% of the time.
• Not involved in any mining were sold below the county value 15.8% of the time.
• Closed room-and- pillar mines were sold below the county value 14.3% of the time.


Exhibit 4.4-2 Pie Charts Showing Divergence of Sale Value from County Value
Clearly, no relationship between longwall activities and property sales is apparent. Four geographic views are posed in the exhibits below:
• Exhibit 4.4-3 (Sales at +/- 0% of County Value): areas where average properties sell for less than 0% below county value are shown in red, areas where average properties sell for more than 0% above the county value are shown in green, and properties within the +/-0% range are shown in blue.
• Exhibit 4.4-4 (Sales at +/- 10% of County Value): areas where average properties sell for less than 10% below county value are shown in red, areas where average properties sell for more than 10% above the county value are shown in green, and properties within the +/-10% range are shown in blue.
• Exhibit 4.4-5 (Sales at +/- 25% of County Value): areas where average properties sell for less than 25% below county value are shown in red, areas where average properties sell for more than 25% above the county value are shown in green, and properties within the +/-25% range are shown in blue.
• Exhibit 4.4-6 (Sales at +/- 50% of County Value): areas where average properties sell for less than 50% below county value are shown in red, areas where average properties sell for more than 50% above the county value are shown in green, properties within the +/-50% range are shown in blue.
As the pie charts illustrate, there is no relationship between properties sold for more or less than county value and mining or mine control areas. Most important to this study is that no correlation occurred between location and sale of property in a longwall area when compared to value difference; the percentage of sales less than county value is no higher in longwall areas than either the control or the county as a whole. Where there is a decrease, the percentage decrease is no more or no less in the longwall areas than in the balance of the county, or in the control areas.
Exhibit 4.4-7 shows the pattern of net gain or loss between sale values and assessed values. This map shows where, if the county reassessed the surface real estate on the basis of the sales included in this analysis, the county would likely see an increase in surface real estate market value and, conversely, a decrease in market value of surface real estate. Potential changes in tax revenues are directly related to these changes. As shown in the map, these net changes do not correlate with the location of longwall mining.
 Exhibit 4.4-3 Color Grid of Sales at +/- 0% of County Value
 Exhibit 4.4-4 Color Grid of Sales at +/- 10% of County Value
 Exhibit 4.4-5 Color Grid of Sales at +/- 25% of County Value
 Exhibit 4.4-6 Color Grid of Sales at +/- 50% of County Value
 These data show a consistent pattern in all land use categories, remote, rural,
 Exhibit 4.4-7 Color Grid of Net Gain or Loss Between Sales Value and
County Value
Exhibit 4.4-7 Color Grid of Net Gain or Loss Between Sales Value and
County Value
suburban and urban, longwall, no mining, roads, and sewer and water. About 20% of properties sold for less than county value, more than 50% sold for around the county value, and 20% sold for twice the county value.
The purpose of this exercise was to determine if there was an identifiable relationship between the presence of longwall activities and the overall value of parcels. To justify a cause and effect relationship, the correlation would be expected to be strong. Using all of the attributes that drive value, no clear correlation between longwall mining and property value could be identified. In the absence of other variables, there appears to be a slight negative correlation between the presence of longwall activity and value assessed by the counties. The county assessments tend to show lower values in longwall areas. But other factors such as sewer and water have stronger correlations with the county values. When these factors are added to the mix, there is NO significant identifiable correlation between longwall mining and property value.
In some cases, the longwall activity may result in a general increase in value. For example, in Greene County RAG has constructed and paid for more than 20 miles of water line south of Waynesburg. This construction was the result of compensation for damages and potential damages related to the company’s longwall activity. Access to water lines includes access to fire protection. Regardless of the motive, the data show that property values increased in areas when public sewer and public water were made available. While RAG activities may or may not have damaged some individual properties and while RAG may or may not have appropriately compensated the individual owners, this statistical study indicates that, in general, the company’s mitigation activity (constructing the water line) tends to increase the value of properties in the area.
Under Act 54, the mining company is required to compensate for the cost of the damage. Property-specific diminished value may result from the following:
• If the homeowner received an assessment decrease based on damage and then repaired the structure but did not notify the assessment office of the repair, the county value will remain artificially low.
• If the landowner received compensation but chose not to repair damages, the value of the property will remain diminished
• If the structure is sold before it is repaired, the value will have been captured as diminished.
• If the repair was not adequate or if no repair was undertaken, the value will remain diminished.
• If the assessment appeal boards respond without adequate market analysis, the assessment appeal may be incorrect.
• If a homeowner received compensation for damages and used the money to make major renovations (such as a new kitchen) in a part of the house not damaged by undermining, and if the house was not reassessed, the assessed value may be diminished.
In point of fact, most of the longwall mining occurs in the remote and rural land areas. Frequently, the mining occurs where there is no public infrastructure. Therefore, the values are among the lowest per unit area in both counties. This pattern has not changed perceptibly over the last 10 years. Value appears to have risen at road intersections, near heavily traveled “commuter corridors,” and where public infrastructure has been installed. Values do not appear to have declined any more or less near longwall areas than elsewhere in the more economically depressed rural areas of the counties. Site-specific exceptions to this general observation do occur. But to a large extent, these site-specific value reductions are apparently related to specific mining damage that may include water loss (permanent or temporary). Numerous anecdotal evidence has been offered to substantiate this observation. In addition, the coal companies have acknowledged damage to surface property with claim settlements, and various subsidence insurance claims have been filed. Both the coal settlements and the insurance claims have been analyzed in this study.
The balance of the study explores the actions of the assessment appeals boards and the taxes related to coal reserves and coal mining.
Differences in property value based on proximity to longwall mining were analyzed for this study. Properties above longwall mining were compared to similar properties not affected by longwall mining. Comparing sales data and county value data, RTC found no statistically significant correlation between the presence of longwall mining and general or average property values. Other factors such as access to infrastructure such as public sewer and water, remoteness of site (land use density), and proximity to a roadway have more pronounced relationships to value than proximity to mining.
5.0 ANALYSIS OF ASSESSMENT CHANGES RELATED TO APPEALS
Sections 3 and 4 of this report discussed whether properties undermined by longwall operations change in county value. The GIS approach used for this project allowed for all properties in longwall mining areas in both counties to be compared to the control groups, as described above, as well as to all properties in their respective county.
In these analyses, it was found that properties above longwall receive an assessment decrease from the county at a slightly greater frequency than properties not above longwall mining. The reduction in county value is not a significant portion of the total tax base. It was also found that the total value of coal company settlements is greater than the total reduction in county value.
The following objective from the Project Work Statement is addressed:
Within the longwall group, determine if there are changes in value
![]() that
correlate to the opening and closing of longwall operations.
that
correlate to the opening and closing of longwall operations.
One of the issues identified for study was whether property values decrease in anticipation of mining – does the announcement of future mining cause a reduction of property values? Most mining area boundaries were established before the beginning of the study period (1993) making analysis of potential value changes related to the anticipation of mining difficult. Ideally, the analysis would involve paired sales – sales of the same property before and after the announcement of the mine plan. There were too few paired sales to complete this analysis. Instead, county records for the three year period prior to initiation of individual mine panels were searched to find assessment reductions that might be related to the anticipation of mining activity
Tax information spanning the last decade was obtained from both Washington and Greene Counties. The information was assembled into a database that included parcel identification numbers, property size, and county value for each available year. The database containing the tax information was mapped using MapInfo Professional 6.5 (a GIS computer program). The mapping process is known as assigning ‘objects’ to the data. A MapInfo object is a map feature such as a polygon. RTC, for example, has made a map of polygons of all of Greene County property parcels. Using the parcel identification number as a link between the parcel map and the tax roll database, map objects were assigned to the database. Similarly, Washington County was assigned objects. However, because only tax index maps were available from Washington County, every parcel in a tax index map was assigned the same object. Now a map exists that shows every parcel in Greene County and the associated database contains information on how property assessment values changed over the past 10 years. In Washington County, the same information can only be mapped to the tax index level.
To determine which properties have been undermined by longwall mining, RTC’s longwall mining maps were connected in the GIS with the tax roll maps. Using GIS makes it easy to see which properties may be affected by longwall mining (Exhibit 5.1.2-1). From the longwall mining database, more columns were added to the tax roll database: ‘Mining Type’ and ‘Date of Mining.’ Using geographic analysis, the new columns were filled with the appropriate information: If a property touches a longwall mining panel, ‘Mining Type’ is filled with ‘Longwall’ and ‘Date of Mining’ is filled with the date that the respective longwall panel was completed.

Exhibit 5.1.2-1 Portion of Greene County Showing Longwall Mining Panels, Completion Dates, and Individual Property Parcels
Every property in Washington and Greene Counties that has been undermined by longwall mining was identified. Because the county value for each property for each year is also in the database, properties whose value has changed and whose locations are associated with longwall mining can be identified. The date that the longwall mining occurred can be compared to the year the property received a county value change to see if there is a correlation. A correlation was assumed if the county value changed and the property was undermined in the three years prior to the value change. For example, if the county value of a property changed in 1997, it was considered potentially due to longwall mining if a panel in the area had been completed in 1997, 1996, or 1995. This process was used to account for time of mining and time needed to appeal the property assessment value to the county.
The above method assumes that longwall mining occurs, a surface property is damaged, and the landowner seeks a reduced assessment. Alternatively, a landowner could seek a reduced assessment through appeal as soon as they learn that longwall mining will occur under their property. This scenario was investigated by looking at the time an assessment reduction occurred and comparing it to longwall mining three years into the future. For example if there is a assessment reduction between 1996 and 1997, it was compared to completed panels in 1997, 1998 and 1999. This type of investigation yielded less property reductions due to longwall mining compared to looking for reductions after longwall mining. In Washington County there were 364 property reductions when assuming property owners seek appeals before mining occurs and 567 property reductions assuming property owners seek appeals after surface damage occurs. In order to attain the maximum possible impact due to longwall mining the method assuming property owners seek assessment reductions after mining occurs was used.
Data were collected and analyzed for the longwall mining areas, the related control areas, and for all properties in both counties. Data from longwall properties was compared both to the control groups and to the respective county as a whole. The comparisons showed whether changes in the longwall population are different from other areas of the county. If there is a difference, it may be said that the longwall mining influenced the assessment of property value.
Data collected included number of properties, total county value, number of properties with changes in county value, the county values of those properties, the number of properties with downward county value changes, the county values of those properties, and the value reduction from the previous year. This information was collected for both counties, for the longwall study areas, and the related control areas. For example, all properties in Greene County were compared to all longwall study area properties and all control area properties in Greene County. In addition, the data was converted to percentages for further comparison.
 Exhibit 5.1.2-2 Portion of Washington
County showing longwall panels (black),
room and pillar mined out areas (orange
crosshatch), tax maps (blue), and DEP
mining claims (red stars). Notice most
mining claims are above room and pillar
areas.
Exhibit 5.1.2-2 Portion of Washington
County showing longwall panels (black),
room and pillar mined out areas (orange
crosshatch), tax maps (blue), and DEP
mining claims (red stars). Notice most
mining claims are above room and pillar
areas.Coal company settlements were also investigated (Exhibit 5.1.2- 2). These data were examined to determine if property owners were being compensated for loss due to mine subsidence. PA Act 54 requires coal companies to make property owners whole for damages. For longwall mining it is clear who is responsible for the damage. For damages from historic room-and-pillar mining, mine subsidence insurance must be used. For counties not to lose their existing tax base, property owners must put compensation back into the property. This subject is further addressed in Section 5.1.3.
Data show that properties above longwall mining receive an assessment reduction at a greater frequency than the total population of properties. In Greene County, over the time period of the study, 2.76% of all county properties received a reduction in county value, while 6.03% of longwall properties were reduced. In Washington County, 1.48% of all county properties were reduced, compared to 4.72% of longwall properties. In both counties, however, the percentage of property value reduction is very small. Over the study period in Greene County, the total property value is $7,641,951,917 and the total reduction is $1,370,900, or 0.017%. In Washington County, the total property value is $53,754,692,047 and property value reduction potentially attributed to longwall mining is $6,057,540, or 0.011%.
Analyses of the countywide data for Washington County showed a significant number of value changes between 1999 and 2000 compared to the other years. These differences were also seen in the longwall population. After contacting Washington County, RTC learned these changes were due to the revaluation of ‘Clean and Green’ properties. ‘Clean and Green’ is a type of tax exemption where land can be taxed on its soil carrying capacity rather than the higher value of the area. With assistance from Washington County, ‘Clean & Green’ changes were removed from the analysis, leaving a total of 21 downward county value changes due to longwall. This value fits nicely with the other years. In Greene County, there were many county value changes from 1997 to 2000 because data for the intervening years was not available. The changes from 1997 to 2000 were averaged over the missing years – 1997-1998, 1998-1999, and 1999-2000.
In Greene County, there are 88 property value reductions potentially attributed to longwall mining activity, and 97 properties with settlements were found when combining coal company and DEP data. In Washington County, there are 173 potential longwall reductions and 196 mining settlements. A valid settlement is one that has been completed and that ranged between $1,000 and $5,000,000. If a settlement was greater than $5,000,000, it was assumed to be an industrial use property.
The amount the coal companies have paid out is much greater than the county value (and subsequent tax revenue) lost in the appeal process (Exhibits 5.1.3-1 and 5.1.3-2). Final settlements can be high, as coal companies frequently pay for damage, buy replacement property, and cover moving expenses, all which is included in the final settlement reported.
 Exhibit 5.1.3-2: Comparison between the
reduction of county value potentially due to
longwall mining and the value of compensation
settlements.
Exhibit 5.1.3-2: Comparison between the
reduction of county value potentially due to
longwall mining and the value of compensation
settlements. Exhibit 5.3.1-2: Comparison between the number
of county value reductions potentially due to
longwall mining to the number o f compensation
settlements.
Exhibit 5.3.1-2: Comparison between the number
of county value reductions potentially due to
longwall mining to the number o f compensation
settlements.Two more types of comparisons were completed. In the first, the longwall population was compared to similar attributes in the county and control group populations. In this type of comparison, for example, in 1994-1995, longwall properties make up 0.86% of all the properties in Greene County. Longwall properties account for 2.40% of all properties that received an assessment reduction in county value, higher than expected. However, these properties only account for a 0.16% reduction in total county value. This means that the properties did not contribute significantly to a drop in the county’s tax base. Similar tables show the results for the control groups in Greene County and for the longwall and control groups in Washington County. The trends in Washington County are similar to Greene County. The number of reductions in longwall mining areas is greater than expected, but the dollar amount is smaller than expected.
 Exhibit 5.1.3-3: Chart shows how the longwall population changes more
frequently than the total population in Greene County.
Exhibit 5.1.3-3: Chart shows how the longwall population changes more
frequently than the total population in Greene County.The second analysis compares attributes within the same population to each other (Exhibit 5.1.3-3). For example, the percentage of properties that have changed county value compared to the total number of properties was analyzed for both the Longwall population and Control Group population. For Greene County in 1994-1995, 1.53% of countywide properties changed county value, compared to 3.66% of longwall properties. How the county value of the longwall properties changes compared to total county value, the number of reductions compared to total changes, and the value of the reductions compared to the value of all the changes is shown. The longwall population is usually a little greater than the control populations. This means there are more changes in the longwall population than in the control. The difference is greater when comparing number of changes than when comparing value of changes. This shows longwall mining affects the number of property value changes in Greene and Washington Counties, but county value is affected to a lesser extent.
Exhibit 5.1.3-3 also shows the results of the longwall population compared to the county population over the entire study period in Greene County. There is a slight, but consistent, increase in frequency of assessment reductions in county value in longwall properties compared to the control groups. Similar results are seen in Washington County and all control areas. However, losses in county value due to longwall properties is 0.017% in Greene County and 0.011% in Washington County compared to the total tax base. The dollar value changes are not as significant as the number of changes. Also, as shown above, the money paid to individuals by coal companies more than makes up for the county value reduction.
5.2. Long- Term and Short-Term Assessment Changes
The following objective is addressed:
Within the longwall group, identify all properties that were reassessed subsequent to longwall mining so as to obtain lower assessment values and to also determine if the reductions were short term or long term.
The methodology for Section 5.2.1 follows the methodology for Section 5.1.2. The number of longwall properties that received an assessment reduction in county value in each county per year can be found was found. In addition, each individual property that received a reduction in value was extracted into a new table. To determine if the changes were short term or long term, the county value for the year before mining, the county value for the year after mining, and the county value for the final year were found.
A short-term county value reduction was identified if a property’s final county value increased after the reduction due to mining and ended at a value of at least 100% of the original value. A long-term county value reduction was identified if a property’s value did not go back up after mining or if it did not go back up to 100% of the original value.
In Washington County, for the year 1999-2000, only the 21 properties not associated with clean and green revaluation were used. Downward county value changes for the final year (2001 for Greene County and 2002 for Washington County) were not used because there is no data for comparison.
 Exhibit 5.2.2-1 County value changes
after longwall mining: Pie chart shows
the final county value compared to the
original county value
Exhibit 5.2.2-1 County value changes
after longwall mining: Pie chart shows
the final county value compared to the
original county valueThere are a total of 239 properties that received an assessment reduction in county value potentially attributed to longwall mining in both counties in the years studied. Exhibit 5.2.2-1 shows that the majority of the properties remain within 80 to 100 percent of their original value at the end of the study period. Twelve percent of properties go up in value, and 55% remain below 80% of the original value.
 Exhibit 5.2.2-Pie chart shows breakdown of
properties affected by Longwall mining: 81%
of properties have long-term county value
changes, 19% have short term county value
changes.
Exhibit 5.2.2-Pie chart shows breakdown of
properties affected by Longwall mining: 81%
of properties have long-term county value
changes, 19% have short term county value
changes.Exhibit 5.2.2-2 shows the breakdown between long-term and short-term property value changes due to longwall mining. One hundred ninety four long-term county value changes have been identified. Of the long-term changes, 55 do not go below 85% of the original value. There are 45 short-term changes. Of these, 30 are above 100% of the original value. This means there was significant improvement to these properties after the value fell.
When looking at the appeal data compared to the settlement data, individuals are being compensated for their loss, but in some instances the counties’ tax bases are losing value because the property assessment values does not go back up to pre- mining values. The properties above 100% of the original value may indicate some compensation is going back into the property. Also, as shown above, the drop in property value due to the long-term changes is insignificant compared to the counties’ property value tax bases.
5.2.3 Longwall Mining Damage and Compensation Process
In general:
• The assessed values of properties underlain by longwall mines are appealed more than properties in control areas
• Properties underlain by longwall mines are granted assessment reductions due to appeal more frequently than properties in control areas
• Properties underlain by longwall mines are granted greater reductions in assessed value than properties in control areas that have filed for appeal.
In theory, properties that were granted reductions in assessment value due to damage caused by longwall mining should return to their original value after repair or compensation from the mining company. Just over 5,000 improved residential properties are located in the longwall regions of both counties. Of these, just under 3,000 are located in areas where longwall mining was active from 1993 through 2002. The vast majority of these properties did not file compensation claims or assessment appeals during the ten year period. The following provides an overview of the number of properties in both counties that are located in the longwall area that filed assessment appeals and/or that received compensation claims:
• 261 properties were identified with assessed value reductions in areas that were underlain by longwall mines
• 235 claims were filed against coal companies in Washington and Greene Counties during the same time period from the same mining locations.
• 95 properties were included in both data sets; the properties were the same
• Of the properties that did not match:
• 166 properties, located within the longwall area were not included in the coal company claims lists (received no compensation)
• 140 properties receiving compensation did seek property assessment reductions
• Not matching may be based on the following:
• Some of the assessment reductions may not be due to longwall mining. The reduction may be based on other market factors, assessment errors, or property revisions
• There may be assessment reductions related to longwall operations where no coal company compensation was obtained:
• Owner did not file
• Company did not grant compensation (While the research did not identify any of these, the investigation did find a few claims that were in dispute -- company offered less than home owner desired. These would have been included as matches between the data sets.)
• Some of the properties where compensation had been paid were repaired and were therefore not eligible for assessment reductions.
• Some homeowners were unaware of the assessment appeals process.
The following tables tracks the 95 properties that are in both populations through the “Longwall Mining Damage and Compensation Process.” Ideally, in the case of properties where damage has occurred. the process should consist of the following steps:
• Longwall mining occurs
• Damage assessment is completed
• Compensation claim is filed
• Mining company compensates property owner (cash settlement or repair)
• Assessment appeal is filed
• Appeal granted if necessary – repair will require more than tax year to complete, damage is permanent (Damage not repairable or property owner chooses not to repair damage.)
• Property repaired
• Assessment value returned to pre-mining value.
As shown below, of the 95 properties that were granted an appeal, 75 received compensation that exceeded the value reduction granted by the appeals process and 20 received compensation that was less than the amount estimated in the appeals reduction. Forty-one of the properties were returned to the pre-mining assessed value; 54 remained at the reduced value as estimated by the assessment reduction process.
Overview of Appeal/Compensation Process |
||||
Step 1 |
Longwall mining occurs and reduction appeal is filed |
|||
Action |
Appeal Denied |
0 |
Appeal Granted |
95 |
Reasons |
1. Appeal board feels there is no reason to reduce value. 2. Site visited and no damage seen |
1. Appeal board feels there is reason to reduce value 2. Site visited and damage seen |
||
Step 2 |
Mining company compensates property owner |
|||
Action |
Compensation less than assessment reduction |
20 |
Compensation greater than assessment reduction |
75 |
Reasons |
1. Landowner believes damage to house greater than coal company paid 2. Coal company refuses to pay correct amount 3. Other factors considered with the appeal (appeal bundled with non-mining related reductions) |
1. Coal company overcompensated to cover costs plus intangibles. 2. Landowner reports greater damage to coal company than actually occurred. |
||
Step 3 |
Property repaired, assessment value returned to pre-mining value |
|||
Action |
Compensation money accounted for in property assessment |
41 |
Compensation money not accounted for in property assessment |
54 |
Reasons |
1. Property owner notified county to increase property assessment to a value reflecting repairs 2. Coal company did not pay any money to landowner. |
1. Coal company did not provide enough money to repair the property adequately. 2. Compensation money not used to repair property. |
||
This section shows that properties above longwall receive an assessment decrease from the county at a slightly greater frequency than properties not above longwall mining. The drop in value is not a significant portion of the county tax base. It was also found that the majority of properties do not receive an assessment increase (return to pre-mining value) in the long run. However, it was found that the total value of coal company settlements is greater than the total drop in county value.
6.0 STUDY OF TAX REVENUES FROM COAL MINING
This study includes an analysis of property tax revenues generated in Greene and Washington Counties from both coal extraction and coal reserves. These data are available for both counties from the respective Tax Assessment Offices. From these data, the effects on tax revenues from longwall mining were obtained.
The following objectives are addressed:
For each county, determine the total annual revenue generated by taxing the coal reserves (mineral estate) of the longwall mining operations, the significance of that revenue as a source of county income, and the extent to which that revenue offsets declines in fair market and assessed value [if the values drop].
Coal accounts for approximately $200,000,000 in market value in Washington County. The county assesses coal based on an assumed market value of $800 per acre for reserve coal and on a variation of the income approach for coal involved in active permits. Some partially mined-out and some reserves are assessed at lower values. The average value of all the coal included in the Washington County assessment system is approximately $675 per acre. Coal is assessed when severed from the surface by deed or lease; coal value is assumed to be incorporated in the value of undivided fee properties. The county assesses approximately 35,000 acres as active at an average of $3,000 per acre and 216,800 acres of reserve coal at approximately $400 per acre. Active coal values vary from $1,000 per acre to just under $7,000 per acre. Most active coal is assessed at around $4,000 per acre.
Coal accounts for approximately $400,000,000 in market value in Greene County. Approximately 38,000 acres are under active mining (84,000 acres are included in permits). Greene County assesses over 200,000 acres of coal. Approximately 116,000 acres are listed as reserves. The market value of active coal varies from $1,000 to $8,500 per acre with the average being approximately $6,400 per acre. Reserve coal is assessed from $25 per acre to $2,000 per acre with the average reserve value assessed at $1,400 per acre.
In Greene County, coal generates approximately $14,000,000 in tax revenue to all taxing authorities. Coal is roughly 35% of the county’s tax base; $2,000,000 of county revenue is generated from property taxes levied against coal estates. West Greene School District, the location of the largest mining operation (Bailey/Enlow Fork), receives nearly 60% of its income from coal revenue. Washington County has a higher population and a more diverse tax base. In contrast, coal accounts for less than 10% of Washington County’s tax base, generating less than $7,000,000 to all taxing authorities.
The value of coal is dependent upon the ability to mine it and the immediacy of the market for mined fuel. Coal that can easily be exploited and sold profitably into today’s market is worth significantly more than coal that is not available for mining or that is expensive to mine or that does not command a relatively high price in the current market.
The use of the income approach for the valuation of the active mines is an accepted appraisal industry practice. The approach is based on the concept that a dollar received today is worth more today than a dollar that will not be received for some years to come – in short there is a cost associated with a delay in realizing income (it costs money to wait for money). Without judging the specific formulas or variables used by the individual counties, it can be said that by using the income approach to value the active reserves (properties within the current mining permits, but not being mined), both counties are maximizing the taxable receipts from the coal operations. Valuation of inactive reserves (outside permit areas and no plans to mine) is more subjective, usually based on a combination of income and comparable sales approaches. Both counties recognize that active mineral properties (properties currently being mined) and active reserves are significantly more valuable than inactive reserve properties.
The key factor in analyzing coal assessment is the realization that the per acre value is a calculated unit value used to get the assessed value on the tax roll. What is valued in all instances is the quantity of minable coal. For example, a six-foot-thick Pittsburgh coal seam (which can produce 10,000 tons per acre) with sufficient area to develop a longwall mine is worth significantly more than a two-foot-thick Sewickley coal seam that cannot support a mine operation. The percent recovery is a key factor in estimating the value of a coal deposit. Surface mines can exploit approximately 83% of the coal in-place, traditional room-and-pillar mines can extract around 50% of the coal in-place, and longwall mining extracts nearly 100% of the coal in panels and more than 50% of the coal in mains and entries (averaging around 75% overall extraction). All else being equal, an acre of surface minable coal is worth more than an acre of deep minable coal and an acre of longwall minable coal is worth more than an acre of conventional minable coal. Minable coal has value, nonminable coal has little if any value.
Minability is both a technical and an economic term. If the coal is technically minable, it may have value. However, coal that cannot be economically exploited has little or no current value. This coal is judged to be speculative and is typically valued accordingly. As an example, in southern West Virginia, some seams are literally too thin to mine. Using the technique of mountaintop removal, coal companies can extract those thin seams along with other more desirable seams. The efficiencies afforded by the technique confers value to the seams. However, the technique results in large-scale destruction of the natural landscape, heretofore an external cost to the coal company. Recent court decisions have made the use of the mountaintop mining technique more difficult and expensive, and perhaps impossible. Because the value of the thin seams was directly related to the (elusive) efficiencies afforded by the mountaintop mining technique, the thin seams no longer have any significant present value. In short, coal that cannot be mined has little if any value.
With the advent of longwall mining, the value of the active Pittsburgh coal seam reserves was significantly increased. This point was established in court in 1991 in Greene County v Consolidation Coal Company. Earlier, the courts had established the precedent of equating all factors that effect value with the assessed value of the coal. The basis for assessing the value of coal was delineated by the Commonwealth Court in 1988 in the appeal of CNG Coal Company v. Greene County Board of Assessment Appeal (551 A.2d. 328). Here the court cited earlier decisions (Ciafonnia v. Washington County Board of Assessment Appeal, 535 A.2d 247 and Philadelphia & Reading Coal & Iron v. Commissioners of Northumberland County, 323 Pa. 185) in its finding that:
The factors to be considered in determining the market value of coal lands have frequently been stated by this court. In addition to the prices paid in sales of similar lands, due regard must be given to the physical features of the property to be valued. The formation of the coal strata should be taken into account as well as the number of veins, their depth, thickness, pitch, basins, their proximity to outcrop, and the character of the separating rock formation. Similarly, the quality of the coal, and whether of a gaseous or nongaseous nature; the kind of overlying surface; the availability of the coal and the difficulty in mining it; the probable quantity of the merchantable coal in the ground with allowance for loss in mining; the demand for the product and all elements that a prudent purchaser would take into consideration should also be taken into consideration.
Over 50,000,000 tons of coal are extracted each year from deposits in Greene and Washington Counties. Coal lands that have been depleted have no remaining coal value. At the rate of extraction, all active properties in both Greene and Washington Counties will be depleted within the next 15 years. Unless new reserves are brought into production, the bulk of the coal tax value in both counties will significantly diminish. In fact, if active mining ceases in the counties, the value of the remaining reserves will also diminish. The value of these reserves is related in part to their proximity to active operations and the likelihood that these valuable activities could be extended into the reserves. A loss cessation of mining would call this basic assumption into question.
 Exhibit 6-1
 Exhibit 6-2
Exhibit 6-1 shows the current and planned coal related tax receipts for Greene County. Exhibit 6-2 shows similar data for Washington County. As shown in both exhibits, the tax income anticipated to be generated from coal deposits will decline. The exhibits show: 1) the immediacy of that decline should mining stop with the currently permitted mining operations and 2) the more gradual (shaded area), but inevitable decline based on the assumption that all current reserves will be permitted by coal companies for future active mining operations.
Should the reserve coal not be converted to actively mined coal permitted – current mining areas expanded to include the unmined coal, coal revenue will cease to be significant in Greene County by the year 2017 and by 2012 in Washington County.
Neither scenario is likely. It is unlikely that no new mines will be opened, nor is it likely that no existing mine will be expanded. It is equally unlikely that ALL existing minable coal will be exploited. In either situation, following the depletion of active mines – what remains is speculative coal value, much of which would be subject to assessment challenge, thus lowering the coal income to the county, schools, and municipalities.
Exhibit 6-3 provides a map showing the relative geographic distribution of the current coal value as compared to the current surface value. Areas portrayed as green are where the coal produces more real estate tax than the surface property, areas portrayed as red are where the surface provides more taxable income than the coal estate, and areas shown in blue are where the contributions to the tax base are approximately equal. Exhibit 6-4 excludes the mined-out areas from the calculation.
 Exhibit 6-3 Coal Value Compared to Surface Value
 Exhibit 6.4 Coal Value Compared To Surface Value Excluding Mined-Out Areas
 Exhibit 6-5
Exhibit 6-5 is the result of subtracting the areas of net loss identified in the surface sales analysis (Section 4.4) from the coal value. The procedure is used to show any areas where surface value loss that may be related to mining exceeds coal value. These would be areas where coal mining resulted in a net loss in tax revenue. As discussed earlier, assuming that losses at the surface are related to unrepaired damages, the losses should be transitory. Therefore net gains by assessing the active coal at high values should offset any loss in surface tax revenue. As shown on the map, there are no areas in either county where there is a net loss in taxable value.
In active longwall mining areas it was shown that the coal has more taxable value than the surface properties. Therefore, the money contributed to the tax base from mining more than offsets any tax revenue loss due to surface property assessment reductions. The affect of longwall mining on surface property value is a site-specific phenomenon, changing some individual property value and not others. While the taxes generated by mining are temporary, so to are surface property assessment reductions if coal company compensation money is used to repair the surface.
Longwall mining operations are taxed higher per acre than most other properties in Greene and Washington Counties. Coal taxes are based on the market value of coal and the quantity of minable coal in place. Not only does longwall make up for loss in property value, it does this at a greater rate than older methods of mining.
Northwestern Greene and southwestern Washington Counties are highly dependent on coal as a tax base. Nearly 60% of the taxes are from coal property. Loss of longwall revenue to these counties would be devastating to county, school district, and municipality income. In areas with longwall mining, coal taxes make up the majority of the tax base.
7.0 LONGWALL ANECDOTAL INFORMATION (MEDIA REPORTS)
As longwall mining reaches more populated areas, the undermining of existing surface structures becomes inevitable. Damage to these structures will occur with severity depending on the width-to-depth ratio of the underlying mine panel and the position of the surface structure in relation to the panel. Historically, emergency subsidence claims to the U.S. Office of Surface Mining, Reclamation, and Enforcement (OSMRE) have all been over abandoned room-and-pillar mining. Exhibit 7-1 shows the distribution of these claims in Washington and Greene Counties. Many of these claims are related to the deterioration and collapse of pillars in old room-and-pillar deep mines that have been abandoned for 50 years or more.
A review of longwall mining in Washington and Greene Counties indicates most of these mines have avoided urban areas, particularly in Greene County. In Washington County, denser population and shallower overburden combine to produce more subsidence events. These events are reported in the media with the effect of dramatizing the severity of individual impacts. While individual events may be severe and have real and significant impact on individual homeowners and landowners, they become much less significant on a countywide scale. The subsidence events are generally reported in the media with headline status, but the same media fail to report mitigating factors along with repairs and restorations made by coal companies. Therefore, care should be exercised in reading such reports as more than often they only tell one side of the story. Coal company compensation data analyzed in relation to property values and reported in this study suggest that coal companies are paying fairly, if not more so, for longwall-induced damages, as required by law.
Longwall mines currently experiencing conflicts with surface structures are the 84 Mine and the Maple Creek Mine, both in Washington County. Maple Creek has announced closure in 2002 and will open new operations at its adjacent New Century Mine. The 84 Mine has experienced major subsidence problems as it moved southward in Washington County in South Strabane Township. Here it had to contend with undermining three major highways: State Route 136, Interstate I-70, and U.S. 40. In 1996, the 84 Mine was blamed for damage to Route 136 forcing closure of the eastbound lane and damage to a 30-inch water line. By late 2000, the mining had progressed south of I-70.
Alignment of the surface roads with the panel orientation has a significant bearing on the potential for subsidence damage. In the Route 136 instance, the major surface damage occurred where the road ran parallel to and over the underlying panel. In the I-70 passage, the parallel road segment was situated over the gate entries and crossed the panel at a sharp angle, limiting exposure to maximum subsidence conditions (GeoTDR, Inc, 2001). Continuing maintenance and adjustments to the highway surface and one overpass during the longwall passage also mitigated the overall subsidence effects. This illustrates that with planning and follow-up action surface subsidence effects can be minimized. Such efforts receive little if any media attention.
 Exhibit 7.1: OSMRE Emergency Subsidence Claims
The following project objective addresses the findings of this report:
Integrate the findings from specific objectives and any other relevant factors
into a comprehensive evaluation of the effects of longwall mining on the value
of overlying surface property and on the tax base in both counties.
![]()
8.1 It was found that residential properties located in longwall mining areas tend to be assessed at lower values than properties located in similar regions without longwall mining. While the relationship was apparent it is not consistent. Four factors appear to be the basis for this finding:
8.1.1 Properties above longwall mining operations are granted more appeals for reductions in assessment than properties in control areas. Property owners in longwall areas tend to file more appeals, and the counties grant more appeals in longwall areas. Granted appeals reduce the assessment more in longwall areas than in non-longwall areas. As a general rule, even after repair, the original value is not reassigned to the properties – thus the “temporary” reduction becomes a permanent loss in the tax base.
8.1.2 Longwall operations are, for the most part, located in the “virgin” coal areas of the counties where there remains large tracts of available coal. The urbanization of the region historically spread from the old coal towns located near the mouths of the depleted room and pillar mines. As a result, the surface properties overlying longwall operations tend to be in the remote and rural areas of the counties. These areas tend not to be improved with public sewer and water. Access to public sewer and water tends to have stronger correlation to value than most other real estate value factors.
8.1.3 Longwall operations do cause damage to properties. While the law requires repair to structures, repair can require some period of time and some damage may not be readily quantifiable (land subsidence, water table changes, etc.). Thus, a longwall operation may have a lagging negative affect on the desirability of the land areas.
8.1.4 Some properties that may have received adequate compensation for damage are not repaired. The land owner may choose to use compensation settlement for other purposes. Thus, a damaged property may remain on the tax rolls at a diminished in value.
8.2 A permanent reduction in value granted to properties by the tax departments because of location near longwall mining operations is not supported by the sales analysis. An analysis of residential property sales shows that there is no consistent relationship between property sales selling for less than county value and property location with respect to mining. Overall, the differences between sales prices and county values does not correlate with the location of longwall mines. The ratio of sales-prices to county-values tends to be higher in urban areas and lower and even negative in the more remote areas of both counties.
8.3Temporary reductions in value because of damage and lag time until repairs are completed may be justified.
8.4 While it was demonstrated that properties above longwall mining operations are granted more appeals for reductions in assessment than properties in control areas, the total value of the annual appeals is not very significant when compared to the total tax base of the county. Obviously, the affect on individual properties may vary widely.
8.5 In general, it would appear that coal companies compensate property owners in excess of the reduction in value shown by the tax appeal. Obviously, the damage and compensation at individual properties may vary widely.
8.6 In the active longwall mining areas the coal tends to offer more taxable value than the surface properties. The coal value is high because it is minable. Therefore, in general, the money contributed to the tax base from mining more than offsets any tax revenue loss due to surface property assessment reductions. The affect of longwall mining on surface property value is a site-specific phenomenon, changing some individual property values and not others. While the taxes generated by mining are temporary, so to should be most of the surface property assessment reductions (if coal company compensation money is used to repair the surface as the sales analysis indicates). The transitory nature of coal property value must be considered by the counties and other taxing authorities. Coal property may be:
○ moderately valuable as reserves before mining
○ highly valuable during mining
○ virtually worthless if unminable
○ worthless if depleted
8.7 Northwestern Greene and southwestern Washington Counties are highly dependent on coal as a tax base. Loss of longwall revenue to these counties would be devastating to county, school district, and municipality income. In areas with longwall mining, coal taxes make up the majority of the tax base.
8.8 One of the issues identified for study was whether property values decrease in anticipation of mining – does the announcement of future mining cause a reduction of property values? Most mining area boundaries were established before the beginning of the study period (1993) making analysis of potential value changes related to the anticipation of mining difficult. Ideally, the analysis would involve paired sales – sales of the same property before and after the announcement of the mine plan. There were too few sales to complete this analysis. Instead, county records for the three year period prior to initiation of individual mine panels were searched to find assessment reductions that might be related to the anticipation of mining activity. These reduction could be indicators of a general relationship between future mining and the opinion of value. There were not enough of these changes to reach any conclusions. Most assessment reductions were assigned after mining commenced.
Adamek, V., Jeran, P.W., and Trevits, M.A., 1987, ‘Prediction of Surface Deformations Over Longwall Panels in the Northern Appalachian Coalfield.” U.S. Bureau of Mines, Report of Investigations 9142.
Coal Age, 2002, “U.S. Longwall Census 2002,” Coal Age Magazine, Feb. 2002,p. 28-32
Dunrud, C. R., 1984. “Coal mine subsidence–western United States,” in Geological Society of America, Reviews in Engineering Geology, Vol 6, pp. 151-194.
Energy Information Administration, October 2000. “Electric Sales and Revenue 1999". U.S. Department of Energy, DOE/EIA-0540(99), (http://www.eia.doe.gov/ cneaf/electricity/esr/esr1999.pdf).
Energy Information Administration, no date. “Coal State Profiles, Pennsylvania Coal Statistics”. U.S. Department of Energy, (http://www.eia.doe.gov).
Fejes, A.J, 1986, .“Surface Subsidence over Longwall Panels in the Western United States.”, U.S. Bureau of Mines, Information Circular 9099.
Fiscor, S., ed., February 2001. “ U.S. longwall census: Longwall’s push the envelope.” Coal Age, 106 (2): 28-34.
Freme, F. , 2000,. “U.S. Coal Supply and Demand: 2000 Review.” Energy Information Administration, U.S. Department of Energy.
GeoTDR, Inc., 2001, “Effects of Undermining Interstate Route 70, South Strabane Township, Washington County, Pennsylvania,” PADEP Contract No. 3500016513, Oct 2000
Ingram, D.K, 1989,.“Surface Fracture Development Over Longwall Panels in South-Central West Virginia,” U.S. Bureau of Mines, Report of Investigation 9242,
Jeran, P.W. and Barton, T.M., 1985, “Comparison of The Subsidence Over Two Different Longwall Panels,” U.S. Bureau of Mines, IC 9042, pp.25-33.)
Jeran, P.W and Adamek, 1988, “Subsidence Due to Undermining of Sloping Terrain: A Case Study,” USBM RI 9205
Keystone coal Industry Manual, 1982, “Pennsylvania Bituminous and Anthracite, Pittsburgh coal”, pp. 612-614, A McGraw-Hill Publication.
McCulloch, C.M., et al, 1975, “Selected Geologic Factors affecting mining of the Pittsburgh Coalbed,” USBM RI 8093.
Moebs, N.M. and Barton, T.M.,1985, “Short-term Effects of Longwall Mining on Shallow Water Sources,” U.S. Bureau of Mines, I C 9042, pp.13-24
National Coal Board, 1975, “Subsidence Engineers Handbook”, Mining Department, London
PADEP, 1999, “The Effects of Subsidence Resulting from Underground Bituminous Coal Mining on Surface Structures and Features and Water Resources”; June.
PADEP, 2001, “The Effects of Subsidence Resulting from Underground Bituminous Coal Mining on Surface Structures and Features and Water Resources”; Supplement to the June 1999 Report; February.
Peng and Yi Luo, 1994, “Protection of Two Residential Houses over two Adjacent Longwall Panels at Humphrey No. 7 Mine,” A Proposal to Consolidation Coal Company, Northern West Virginia Division, Oct. 28, 1994.
Shultz, C. H. (1999). “The Geology of Pennsylvania. Pennsylvania”. Geological Survey and Pittsburgh Geological Survey.
Stingelin, R.W. et al., 1975, “Overview of Subsidence Potential in Pennsylvania Coal Fields,” Appalachian Regional Commission Report ARC-73-1 11-2552
Walker, J.S. and LaScola, 1989,”Foundation Response to Subsidence-Induced Ground Movements: A Case Study” U.S. Bureau of Mines, Report of Investigation 9224
USGS OFR 97-864, 1997, “Map Showing Structure Contours and Overburden Thickness Isopleths of the Pittsburgh Coal Bed in Pennsylvania, Ohio, West Virginia, and Maryland’
Jeffrey R. Kern
David Falkenstern
Ronald W. Stingelin
JEFFREY R. KERN, MRP, ASA
STATE CERTIFIED, GENERAL APPRAISER
EDUCATION
Degrees
M.R.P., Masters of Regional Planning: The Pennsylvania State University. Emphasis land use and resource management, resource economics - 1980
B.A.: Dickinson College. Political Science, minor in Geology, emphasis on land use planning and resource management - 1973
Graduate Work in Public Administration: The Pennsylvania State University. Focus on public finance and land use management - 1977 - 1981
(Ph.D. Candidate, West Virginia University)
APPRAISAL AND REAL ESTATE COURSES/STUDIES
‒ Managing Your Mineral and Real Estate Assets, Pittsburgh Section - Society for Mining, Metallurgy, and Exploration, 2000
‒ Uniform Standards of Professional Appraisal Practice, ASA, 2000
‒ Market Approach to Valuing Businesses, ASA, 1999
‒ Geostatistical Simulation for Mineral Deposit Modeling & Mining Application, Colorado School of Mines, 1999
‒ APCOM ‘99 Computer Applications in the Minerals Industries, Colorado School of Mines, 1999
‒ Marshall & Swift Residential Costing, Assessors’ Association of PA, 1999
‒ Valuation of Pennsylvania Minerals, Assessors’ Association of PA, 1999
‒ Mining In a Volatile World, Mineral Economics & Management Society, 1999
‒ Due Diligence Review and Valuation of Industrial Mineral Acquisitions, Society for Mining, Metallurgy, and Exploration, 1999
‒ Uniform Standards of Professional Appraisal Practice, McKissock Data Systems, 1998
‒ Economic Globalization of the Mining Industry, Mineral Economics and Management Society, 1998
‒ Economic Evaluation and Investment Decision Methods, Colorado School of Mines, 1997
‒ Uniform Standards of Professional Appraisal Practice, McKissock Data Systems, 1997
‒ Income Capitalization, McKissock Data Systems, 1997
‒ Coal Taxation, Virginia Polytechnic Institute State University, 1997
‒ Evaluating, Buying, & Selling Coal Properties, Coal Outlook, 1997
‒ Coal Taxation, Virginia Technical Institute, 1996
‒ Uniform Standards of Professional Appraisal Practice, ASA, 1996
‒ Regression Analysis as an Appraisal Tool, McKissock Data Systems, 1995
‒ Uniform Standards of Professional Appraisal Practice, ASA, 1994
‒ Real Property Appraisal, Income Producing Properties III, ASA, 1992Fundamentals of Real Estate, Polley School, 1991(State Certification Requirement)
‒ Real Estate Practice, Polley School, 1991 (State Certification Requirement)
‒ Appraisal Ethics and Practice, Polley School, 1991
‒ Real Property Appraisal II, ASA, 1990
‒ Real Property Appraisal, Income Producing Properties I, ASA, 1990
‒ ASA Value-Tape Series (self-study materials for preparation for certification examinations) Including:
‒ Cost Manuals and Cost Data
‒ Depreciation Recapture
‒ Mobile Home Park Appraisals
‒ Cost Is Not Always Value
‒ Market Approach to Basic Rural Appraisal
‒ Partial Acquisition of a Farm Property
‒ Appraisal Practices in the Army Corps of Engineers
‒ Appraisal of Machinery and Equipment
‒ Ad Valorem Taxes and Real Property Appraising Income Properties for Mortgage Loans
‒ Eminent Domain: Principals of Fixtures Appraisal
‒ How to Determine the Feasibility of an Apartment Project
‒ Valuation of Public Utilities for Ad Valorem Taxation
CERTIFICATIONS, HONORS, AND ACTIVITIES
Certifications
‒ Certified General Appraiser: Pennsylvania GA 000447-L
‒ Certified General Appraiser: New York
‒ Certified General Appraiser: New Jersey RG 00830
‒ Certified General Appraiser: West Virginia 226
‒ Senior Member: American Society of Appraisers, Tested in Real Property - Natural Resources - Technical Valuations Discipline
‒ Member National Association of Realtors
‒ Member National Association of Independent Fee Appraisers
‒ Member International Assessing Officers
‒ Board of Directors, Mineral Economics Management Society
GUEST LECTURER, SPEAKER, EDUCATOR
‒ Valuation of Pennsylvania Minerals: Annual Assessors Association of Pennsylvania, 2000
‒ Uniform Standards of Professional Appraisal Practice: ASA, 2000
‒ Mineral Valuation: Society for Mining, Metallurgy, and Exploration, 2000
‒ GIS, Tax Assessment, and Local Government: APP, 2000
‒ GIS and Real Estate Tax Assessment: Continuing Education for West Virginia Appraisers, 2000
‒ GIS and Real Estate Tax Assessment: Assessors Association of Pennsylvania, 2000
‒ Reserve Coal Appraisal Methodology: Virginia Tech, 1999
‒ Valuation of Pennsylvania Minerals: Annual Assessors Association of Pennsylvania, 1999
‒ GIS and Property Tax Appraisals: Annual Assessors Association of Pennsylvania, 1999
‒ Business Management, Rehabilitation Services: Industrial Services, College of Education (Rehabilitation Counseling), The Pennsylvania State University, 1993
‒ Business Management, Rehabilitation Services: Industrial Services, College of Education (Rehabilitation Counseling), The Pennsylvania State University, 1992
‒ Business Management, Rehabilitation Services: Industrial Services, College of Education (Rehabilitation Counseling), The Pennsylvania State University, 1991
‒ Business Management, Employee Assistance Plan Opportunities, College of Education (Rehabilitation Counseling), The Pennsylvania State University, 1990
‒ Business Management, Rehabilitation Hospital Locations, College of Education (Rehabilitation Counseling), The Pennsylvania State University, 1990
‒ Hospital Location, Development, and Administration in the For-Profit Sector, College of Education (Rehabilitation Counseling), The Pennsylvania State University, 1989
‒ Rehabilitation Environment, Council on Disabilities, 1988
‒ Remote Sensing Workshop, Pennsylvania State University, 1982
‒ Careers in Geography Workshop, Geography Department, The Pennsylvania State University, 1982
‒ Remote Sensing Workshop, Pennsylvania State University, 1981
EXPERIENCE
1980 - Present: Resource Technologies Corporation
President: Responsible for finance, business development, and corporate management
Appraisal Projects - Commercial and industrial appraisals including:
• Natural resources such as coal, oil, gas, sand, gravel, clay, limestone, and other minerals
• Environmentally sensitive properties
• Hospital and medical facilities
• Condominium and vacation properties
• Technical and business properties including associated equipment
• Rural agricultural lands and farms
• Recreational lands
• Mass appraisals
Many of these efforts have involved condemnation and/or taxation and most have required court presentation with values ranging from $1,000 to $500,000,000. Appraisal clients have included the following federal clients:
• U.S. Department of Defense, Army Corps of Engineers
• U.S. Department of Interior, Office of Surface Mining
• U.S. Department of Treasury, Internal Revenue Service
• U.S. Department of Justice, various divisions
Other current state, local, and private clients include:
• Tri-County Habitat for Humanity
• FDIC-NE Service Center
• Glenn O. Hawbaker, Inc.
• Greene County, Pennsylvania
• State of West Virginia
• United Miners' Workers
• U.S. Park Service
• Mid-State Bank and Trust Company
• Rhoads and Sinon, LLP
• Schuylkill County, Pennsylvania
• LaFarge Canada, Inc.
• Essroc Materials, Inc.
• Blue Coal Corporation
• Ernst & Young, LLP
• Fayette County, Pennsylvania
• Arthur Andersen, LLP
• J.E. Baker, Inc.
• ProData Services, Inc.
• Hook and Hook, PC
• West Virginia Education Association
• The Foundation of Monongalia General Hospital, Inc.
• National Bank of the Commonwealth
• Centre County, Pennsylvania
• Clinton County, Pennsylvania
• Beltrami Enterprises, Inc.
• Fleet Bank
• Common Cause of West Virginia
Current efforts involve the complete reassessment for tax purposes of all minerals in the Pennsylvania Counties of Centre, Clinton, Greene, Fayette, and Schuylkill. Additionally, current efforts include development of a reserve coal assessment system for the state of West Virginia.
Expert testimony has been accepted in numerous courts, specifically:
• United States District Court, Northern District of West Virginia
• United States District Court, Middle District Court of Pennsylvania
• United States District Court, Western District of Pennsylvania
• United States District Court, Eastern District of Kentucky
• United States Bankruptcy Court, Wilkes-Barre, Pennsylvania
• Various State and Local Courts
RECENT APPRAISAL PROJECTS
• Allegheny Energy Power Plant in Pennsylvania, Client: Greene County, Pennsylvania
• Coal Fines Recovery Facilities, lands, and operations in West Virginia, Client: Ernst and Young, LLP
• Hard Rock Quarry Operation in Colorado, Client: Fleet Bank
• Aggregate Operation in British Columbia, Client: Arthur Anderson
• All coal reserves in State of West Virginia, Client: Department of Tax and Revenue, State of West Virginia
• Federal Acquisitions including coal, oil, gas, other minerals and rural lands in various states for Federal prison construction, Client: U. S Bureau of Prisons
• Clay Mine and Manufacturing Facility, Midwest United States, Client: Coast Business Credit
• Sodium Sulfate Deposit and Processing Operation, Cedar Creek Texas - Client: Fleet Bank
• Limestone and Aggregate Mine in British Columbia, Canada - Client: Arthur Andersen, LLP
• Slate Mine and Processing Operation, Eastern Pennsylvania - Client: Confidential
• Bus Station and Garage, Pennsylvania - Client: Confidential
• Paper Production Plant - Client: West Virginia Department of Tax and Revenue
• Limestone and Aggregate Mine and Cement Production Facility in Western Pennsylvania - Client: Essroc Materials, Inc.
• Limestone and Aggregate Mine and Cement Production Facility in Eastern Missouri - Client: RESCO
• Limestone and Aggregate Mine and Cement Production Facility in Western British Columbia - Client: LaFarge Canada, Inc.
• Coal Reserves in Western Pennsylvania - Client: Greene County, Pennsylvania
• Gas Storage Field in Western and Central Pennsylvania - Client: Confidential
• KMG Minerals, Inc. Specialty Mineral Products - Client: Confidential
• All Reserve Mineral Properties in West Virginia - Client: West Virginia Department of Tax and Revenue
• All Reserve Mineral Properties in Fayette County, Pennsylvania - Client: West Virginia Department of Tax and Revenue
• Dimension Stone Reserves in South Dakota, Minnesota, and Texas - Client: Confidential
• Sand, Gravel, and Dolomite Operation, Tampa Florida - Client: Barclays Business Credit
• Oil and Gas and Other Minerals in Centre, Greene, and Clinton Counties, Pennsylvania - Client: Various County Real Estate Tax Departments
• Damages Caused by Undermining Of Cemetery, Braddock Cemetery Association, Inc. - Client: Hook and Hook, PC
• Review of Coal Reserve Assessment System, West Virginia - Client: Common Cause, Federation of Teachers, et. al.
• Wood Product Reprocessing Business - Client: Keystone Financial Services
• Scenic Easement and Rights-of-Way, Youghogeny River - Client: Curry Lumber Company
• Selection of Potential Mineral Sites - Client: Glenn O. Hawbaker, Inc.
• Nursing Home, Greene County, Pennsylvania - Client: Greene County Commissioners
• Coal, Oil, and Gas Reserves and Rural Lands in four Pennsylvania Counties - Client: United Properties Group
• Condominium and Vacation Complex, Monroe County, Pennsylvania - Client: GE Capital Credit
• Coal Refuse Processing Operation, Western Pennsylvania - Client: Comerica Bank
• Four Operating Deep Mines in Western Pennsylvania - Client: Fleet Financial Services
• Coal Refuse Resources, Eastern Pennsylvania - Client: Rhoads & Sinon, LLP
• Nursing Home, Jefferson County, Pennsylvania - Client: Nursing Home Corporation
• Large Bankrupt Coal and Land Estate - Client: Beltrami Enterprises, Inc.
• Lands and Resources Associated with a 20-Mine Holding Company - Client: Schuylkill County, Pennsylvania
• Coal Reserve Values - Client: Wheeling Creek Water Shed
• Granite Mining Operations, Wisconsin and Texas - Client: Barclays Business Credit
• Coal Processing Plant, Coal Tipple, Rail and River Load-out - Client: Private Financial Organization
• All Mineral Properties, Centre County, Pennsylvania - Client: Centre County Board of Assessment
• Sand, Gravel, and Dolomite Operation, Tampa, Florida - Client: Barclays Business Credit
• All Mineral Properties, Greene County, Pennsylvania - Client: Greene County Board of Assessment
• Sand and Gravel Operation, Northern Tier Pennsylvania - Client: First Bank
• Sand and Gravel Operation, Atlantic County, New Jersey - Client: Atlantic Counties Utilities Authority
• Silverbrook Anthracite, Coal, Culm, and Land Resources - Client: Bank of Seoul, Korea
• Consolidated Coal, Greene County Coal Properties - Client: Greene County, Pennsylvania
• Consolidated Coal/Monongahela Railway Rail Spur - Client: Tarasi and Johnson, PC
• Uranium Mine Tailings Depository - Client: U.S. Corps of Engineers
• Coal Reprocessing Facility - Client: Pressed Steel, Inc.
• Coal Processing and Shipping Facility - Client: Hook and Hook, PC
• Coal, Oil, and Gas Reserves and Operations, Stonewall Jackson Lake West Virginia - Client: U.S. Army Corps of Engineers
ADDITIONAL EXPERIENCE
Technical Advisor, Participant: National Conference on U.S. Coal Reserves, U.S. Department of Energy. Provide input concerning criteria to determine U.S. coal reserves, volumes, and value.
Technical Advisor, Senior Economics Analyst: "Defining the Anthracite Resources" for the U.S. Department of Energy. Economic analysis focused on the national and world coal market to the year 2010 as well as the local economic, regulatory, labor, and transportation situation.
Principal Investigator: "Concepts for the Protection Against Catastrophic Events” for the U.S. Department of the Interior. Project involved extensive interviews, literature searches, and analyses concerning various legal, financial, and other instruments potentially available to avoid, mitigate, or abate problems that are associated with the long-term effects of mining. Instruments evaluated included bonding, local planning options, insurance programs, surety arrangements, regulatory programs, legal restrictions and covenants, and disaster assistance programs. Both a policy and economic analysis were included in the report.
Principal Investigator: Development and publication of a self-instructional aerial photographic and inspection handbook for federal, state, local, and private environmental personnel. The 150+ page textbook includes numerous "hands-on" learning exercises and case studies.
OTHER BUSINESS INTERESTS
Owner, CEO: Talleyrand Inpatient Rehabilitation Facility - 1983 - 1987
Director of Business Development: Central Pennsylvania, National Medical Enterprises, Rehabilitation Hospital Services Corporation - 1988
Owner, President of E.A.P. Design, Inc.: Employee Assistance Program provider to major Pennsylvania Businesses - 1987 - 1993
SELECTED PUBLICATIONS AND REPORTS
1999, (Torries, T.F.), Use of Geographic Information Systems Technology to Value for Ad Valorem Tax Purposes Coal Reserves Deposit, Society of Mining Engineers, Denver, Colorado
1998, (Torries, T.F.), Use of Geographic Information Systems Technology to Evaluate Large Mineral Deposit, Minerals Economics and Management Society, Calgary, Canada
1989, (Stingelin, R.W.) "Analysis of Coal Tipple And Loadout Needs Along the Monongahela River From Milepost 60 Below the Maxwell Lock And Dam to Milepost 100 Above Lock And Dam Number 8"; Contract DACW69-89-D-0012-0001, U.S. Army Corps of Engineers, Huntington District, Huntington, West Virginia.
1984, (Stingelin, R.W., McGrory, B.J.) "Defining the Anthracite Resources of Northeastern Pennsylvania”, Contract J0333932, U.S. Bureau of Mines, Pittsburgh Mining Research Center, Resource Technologies Corporation Final Report 1003-F.
1983, (Evans, B.M., Stingelin, R.W.), "Low Altitude Photointerpretation Manual for Surface Coal Mining Operations”, U.S. Geological Survey, U.S. Office of Surface Mining.
1981, (Kern, J. R., et. al.) "Concepts for Protection Against Catastrophic Events Resulting from Coal Mining”, Contract J5101061, Office of Surface Mining, U.S. Dept. of the Interior, Washington, D.C., Resource Technologies Corporation Final Report 1004-F.
1981, "Semi-Automated Land Cover Change Detection from Sequential Aerial Imagery as a Resource Planning Tool", M.R.P. Dissertation, The Pennsylvania State University.
1980, (Kern, J.R., et. al.) "SWMIS - Solid Waste Management Information System - Specifications", Contract ME79640, The Pennsylvania Department of Environmental Resources, U.S. Environmental Protection Agency.
1979, (Stingelin, R.W., et. al.) "Premining Identification of Hazards Associated with Coal Mine Roof Measures", Contract J0177038, U.S. Bureau of Mines, Pittsburgh, Pennsylvania, HRB Singer, Inc. Final Report 516-F.
1979, (Armstrong, R. M., Kern, J.R., et. al.) "SUMIS - Surface and Underground Mine Management Information System - Specifications", Contract ME78766, The Pennsylvania Department of Environmental Resources, U.S. Office of Surface Mining.
1978, (Kern, J. R., et. al.) "Evaluation of Color Infrared Aerial Photography Data for Regional Wildlife and Land Use Inventory and Analysis", Contract 14-14-0008-2161, U.S. Fish and Wildlife Service, Fort Collins, Colorado. 1978, (Stingelin, R.W. and Kern, J.R.) “Impact of Coal Gasification and Mine Degasification on Appalachian Coal Production", Battelle Columbus Laboratories.
1979, (HRB Singer, Inc.) "Digital Mapping for Waterways Monitoring and Surveillance", Contract DACW59-78-C-0113, U.S. Army Corps of Engineers, Cincinnati, Ohio.
1977, (Stingelin, R.W., et. al.) "A Bibliography of Appalachian Coal Resources and Reserves”, Battelle Columbus Laboratories.
1976, (Stingelin, R.W., et. al) "The Impact of Overmining and Undermining on the Eastern Underground Coal Reserve Base”, Contract J0357129, U.S. Bureau of Mines, Pittsburgh, Pennsylvania, HRB Singer, Inc. Final Report 500302-F.
David Falkenstern, MS
Gis Programmer
EDUCATION
Master of Science (2000) Environmental and Engineering Geosciences, Radford University, Radford VA.
Bachelor of Science (1997) Geosciences, Hydrogeology Option, The Pennsylvania State University, University Park PA.
EXPERIENCE
Resource Technologies Corporation, September 2000 - Present
Mr. Falkenstern is responsible for bridging spatially oriented data with power computer models to produce the framework to make sound environmental, economical, and planning decisions. Recent projects include:
County Mineral Taxes, Managed the valuation of mineral properties in Greene and Fayette Counties for tax purpose.
West Virginia Reserve Coal Valuation Model, West Virginia Department of Tax & Revenue - Assigns tax value based on coal seams, coal quality, and mining consistency and economics.
Mountain Top Removal Project, U.S. Environmental Protection Agency - Estimated minable coal resources remaining in West Virginia when changing environmental scenarios for Phase I of Mountain Top Removal Environmental Analysis. Considered Mountain Top Removal/Mining, Contour Mining, Auger Mining and Deep Mining.
Implementation of VISION Tax Assessment Software, County of Greene, PA - Maintain Oracle and Access databases capable of linking to MapInfo for spatial analysis of data.
PREVIOUS EXPERIENCE
Programmer, Radford University Technology Assistance Center (2000) – Coordinated the distribution of new computers to faculty and staff. Responsible for the installation of operating systems, various software programs, additional hardware, and associated drivers on computers.
Computer Lab Manager, Radford University Academic Computing (2000) – Responsible for the daily operation of five general-use computer labs. Served as the Walker Technology Center Webmaster (www.runet.edu/~walkertc). Taught classes on Microsoft Office 2000 and Internet applications. Resolved problems involving computers, printers, scanners and multimedia equipment and managed 40 undergraduate student workers.
Geology Intern, Dupont White Pigments, Engebo, Norway (1997) – Logged core to determine if rutile eclogites is an economical source of titanium. Produced geologic cross sections to help determine future drilling sites. Developed a database to store drilling data using Microsoft Access.
LAN Engineer Assistant, Penn State Office of Telecommunications University Park, PA (1992 - 1994) - Installed latest hardware upgrades in office computers. Maintained over 100 computers and printers. Preformed tape back-ups for office servers.
COMPUTER SKILLS
Languages and Software - Microsoft Office 2000, ArcInfo, ArcView, HTML, Perl, C, Microsoft FrontPage 2000, Imagine, RockPac, Adobe Photoshop, MapInfo, Corel.
Operating Systems - Windows NT, 95, 98, Macintosh, UNIX.
HONORS AND ACTIVITIES
Member, Association of Engineering Geologists (1997 - Present)
Recipient, Radford University Graduate Grant (1997 - 1999)
Recipient, Ronald A. Landon Endowment in Hydrogeology (1996 - 1997)
Recipient, Edwin L. Drake Scholarship ( 1996)
Ronald W. Stingelin, Ph.D
Certified Professional Geologist (CPG #3555)
Registered Professional Geologist (PA #83, KY #468)
EDUCATION
Ph.D. in Geology (1965) The Pennsylvania State University
M.S. in Geology (1959) Lehigh University
B.S. (Geology) (1957) The City College, City University. Of New York
SHORT COURSES
Introduction To Mine and Quarry Valuation, IAAO Workshop 250, Denver, CO, 1997
Remote Sensing/Surface Mining Workshop, National Mine Health and Safety Academy, Beckley, WV, 1981
Coal Mining Exploration, The Pennsylvania State University, 1978
Fundamentals Of Rock Mechanics, The Pennsylvania State University, 1977
Elements of Coal Preparation, The Pennsylvania State University, 1977
Microwave Remote Sensing Of Earth, Ocean, and Atmosphere, George Washington University, 1976
Coal Characteristics And Coal Conversion Processes, The Pennsylvania State University, 1974
Elements Of Coal Mining, The Pennsylvania State University, 1973
INTERNATIONAL FIELD EXPEDITIONS
24th International geological congress, Montreal, Canada, Trip A66, Arctic islands: In ten days (August 9-18, 1972) the party representing residents of ten nations covered 14,384 miles in a DC 7 from Baffin Island to Alaska and to latitude 81 under warm and expert guidance in the geology, history, and humanities of the far north. Quartering was at Edmonton, Frobisher Bay, and Inuvik, with visits to Resolute, Cambridge Bay, Tuktoyaktuk, Norman wells, and Yellowknife and many thousands of miles of low level (200 feet) flight over the arctic tundra.
Ninth International Conference On Carboniferous Stratigraphy and Geology, May 9-16, 1979, Field Trip No. 1, “Proposed Pennsylvanian System Stratotype VA and WVA”, Trans West Virgina from Princeton to Morgantown examining the coal bearing strata of the Pennsylvanian System.
August 27-September 1, 1968, Nicaraguan geothermal activity, Manaqua to Leon, pre-proposal field examination of geothermal manifestations potentially detectible utilizing airborne thermal imaging techniques.
MANAGEMENT SEMINARS AND WORKSHOPS
Management Development Programs, The Pennsylvania State University,
► Management By Objectives Seminar (March 1975)
► Performance Evaluation Workshop (May, 1975)
Management Development Programs, HRB-Singer, Inc., State College, PA.
► Management Development Workshop, 1974
► Management Orientation Seminar, 1968
EXPERIENCE
1980-Present: RESOURCE TECHNOLOGIES CORPORATION
Certified/Registered Professional Geologist/ Abandoned Mine Lands and Mineral Resource Specialist
Expert Testimony: has been accepted in numerous courts including:
-Greene County, Pennsylvania (1996, 2000) concerning subsidence caused by longwall mining under a cemetery.
-Allegheny County, Pennsylvania (1996) concerning Coal and limestone resources
-Schuylkill County, Pennsylvania (1995) concerning taxable anthracite coal reserves
-Laurel County, Kentucky (1994) concerning oil and gas reserves in Clay County, Kentucky.
- Western District Of Pennsylvania, Pittsburgh, Pennsylvania (1990) concerning coal reserves, mining feasibility, and Tipple usage in Fayette County, Pennsylvania.
- Greene County, Pennsylvania (1989), Waynesburg, concerning coal reserves and mining feasibility of County coal tracts.
- Northern District Of West Virginia, Elkins, West Virginia (1983, 1985, 1987, Ongoing) concerning coal, oil, and gas reserves and mining feasibility in Lewis County, West Virginia.
- Middle District Court Of Pennsylvania, Williamsport, Pennsylvania (1983) concerning anthracite resources and mining feasibility in the Wyoming Valley, Luzerne County, Pennsylvania.
- Western District Of Pennsylvania, Pittsburgh, Pennsylvania (1988) concerning coal reserves and mining feasibility in Indiana County, Pennsylvania.
- Monmouth County, New Jersey (1986) concerning quantity, quality, and mining feasibility of sand and gravel deposits in Wall Township, Monmouth County, New Jersey.
- Gloucester County, New Jersey (1987, 1989, 1990) concerning quantity, quality, and mining feasibility of glauconitic deposits (Greensands) in Deptford Township, Gloucester County.
- Lackawanna County, Pennsylvania (1975) concerning the use of airborne thermal imagery in mapping underground coal fires.
Recent Appraisal Projects:
Coal, Oil, And Gas
-Prepared estimates of remaining recoverable coal on a previously deep mined property in Allegheny County, Pennsylvania (2000)
-Prepared and mapped methodologies for assessing the coal and non coal mineral reserves of Fayette County, Pennsylvania (1997
-Prepared methodologies for assessing the coal reserves of West Virginia (1996-1997)
-Prepared estimates of remaining minable anthracite coal reserves for active mining operations in Schuylkill County, Pennsylvania (1995-1996)
-Geologic reports on subsidence effects of longwall coal mining under a cemetery in Greene County, Pennsylvania (1996, 1999)
-Prepared estimates of remaining resources of coal, oil, and gas for a property near Manchester, Clay County, Kentucky
-Prepared estimates of remaining resources and minable reserves for approximately 13,000 acres of land in Schuylkill County, Pennsylvania (1994)
-Prepared estimates of remaining coal reserve acreage in West Finley, East Finley, Morris, Donegal, Blaine, Buffalo, South Franklin, and Mount Pleasant Townships, Washington County, PA., and oil and gas potential in the District (1989-1990).
-Prepared estimates of remaining coal reserve acreage for active mining and reserve blocks in Greene County, PA inclusive of the Pittsburgh, Sewickley, and Waynesburg coal seams, and oil and gas potential in all townships (1988-1990).
-Prepared estimates of the remaining coal resources and reserves and mining feasibility for properties in Burrell Township, Indiana County, Pennsylvania (1987).
-Prepared estimates of remaining bituminous coal, oil, and gas reserves and mining feasibility for numerous properties in Lewis County, West Virginia (1983 - 1988) and for a property in Taylor County West Virginia (1992).
-Prepared estimates of remaining coal, oil, and gas reserves and mining feasibility for numerous properties in Fayette and Greene Counties, Pennsylvania (1988,1989,1990).
-Prepared estimates of remaining coal refuse for an on-going anthracite coal recovery operation in Luzerne County, PA (1986).
-Prepared estimates of remaining coal, oil, and gas reserves for Centre and Clinton Counties, Pennsylvania (1981, 1982).
-Prepared estimates of remaining bituminous coal reserves and mining feasibility for properties in Upshur County, WV (1983).
-Prepared detailed estimates of the remaining anthracite resources and reserves in the four coal fields of northeastern Pennsylvania (1980-1984).
-Prepared remaining anthracite coal resource/reserve estimates and mining feasibility for numerous properties in Lackawanna, Luzerne, and Schuylkill Counties, Pennsylvania (1981-1984).
-Prepared estimates of remaining semi-anthracite reserves and mining feasibility for properties in Sullivan County, PA (1981).
Other Minerals
-Prepared a geotechnical analysis of a commercial greensand mining operation in Mantua Township, Gloucester County, New Jersey (2000)
-Prepared a geotechnical analysis of a potential limestone aggregate reasource in Elk County, Pennsylvania (2000)
-Exploratory drilling and core logging for Type A sandstone aggregate in Tioga County, Pennsylvania (1997, 2000)
-Prepared a geotechnical analysis for a commercial slate quarrying operation in Northampton County, Pennsylvania (1997)
-Prepared estimates of remaining dolomitic limestone deposits for a commercial quarrying operation in St. Francois County, Missouri (1996)
-Located potential limestone, sandstone, and gravel reserves for aggregate production in Huntingdon, Mifflin, Juniata, Clinton, Lycoming, and Tioga Counties, Pa. (1995/96)
-Prepared estimates of reserves and evaluated granite quarries in Minnesota, South Dakota, and Texas (1994)
-Prepared estimates of remaining sand and gravel deposits on Blue Coal Property in Luzerne County, Pennsylvania (1993)
-Prepared estimates of remaining silica sand deposits for a natural Area in Cumberland County, New Jersey (1992)
-Prepared estimates of remaining glauconitic deposits (Greensands) for a property in Deptford Township, Gloucester County, New Jersey (1984).
-Prepared estimates of economically minable sand and gravel deposits for a property in Monmouth County, New Jersey (1985), a property in McKean County, Pennsylvania (1992), and a property in Atlantic County, New Jersey (1993).
-Prepared estimates of economically minable high-quality limestone for a property in Huntington County, PA (1982, 1987).
-Located sites and potential aquifer zones for exploratory drilling for groundwater wells in Centre, Clinton, Jefferson and Mifflin Counties, Pennsylvania (1988,1989, 1990).
Additional Project Experience
Development of coal seam data for usage in Geographic Information System modeling efforts.
Provided Phase I Environmental Site Assessments for various project sites in Centre County, Pennsylvania.
Provided Geotechnical and Inspection and Monitoring Services related to the investigation and analysis of problems arising from abandoned mine lands on over 50 projects for the U.S. Department of the Interior, Office of Surface mining and Reclamation.
Co-Author of a self-instructional manual for the U.S. Geological Survey and Office Of Surface Mining entitled "Low Altitude Photo-interpretation Manual For Surface Coal Mining Operations." Published November 1983 by Resource Technologies Corporation, State College, PA 16804.
Technical advisor for a 1981 study for the Office of Surface Mining entitled "Concepts For Protection Against Catastrophic Events Resulting From Coal Mining."
Principal Investigator on a study for the U.S. Bureau Of Mines entitled "Defining The Anthracite Resources Of Northeastern Pennsylvania." This 1984 report defines the physical size and geologic distribution of anthracite coal resources in Pennsylvania that are potentially recoverable using surface and underground mining methods. It also presents an analysis of the potential market value of this energy resource.
Office of Surface Mining and Reclamation (OSMRE) Project Experience
Provided geotechnical and inspection and monitoring services related to the investigation and analysis of problems arising from abandoned mine lands. A listing of projects follows:
PO0012036 Evans Mine Shaft Subsidence, Madera, Bigler Township, Clearfield County, PA, March 2000, TPO Stephen Rathbun 412 937-2135
PO09912056 Ansonville Mine Shaft Subsidence, Ansonville, Jordan Township, Clearfield County, PA, May 1999, TPO George Popper 412/937-2165
PO09712157 Sutton Subsidence, Hawk Run, Clearfield County, PA, June 1997, TPO Rick Balogh 412/937-2136
PO09712557 Patkalitsky Subsidence, Houtzdale, Clearfield County, PA, Jan. 1997, TPO George Popper 412/937-2165
PO09712535 Good Street II Subsidence, Houtzdale, Clearfield County, PA, Dec. 1996, TPO George Popper 412/937-2165
PO09712505 Carr Subsidence, Houtzdale, Clearfield County, Pennsylvania, October 1996, TPO George Popper 412/937-2165
PO09612157 Ray Street Subsidence, Chester Hill, Clearfield County, Pennsylvania, August 1996, TPO George Popper 412/937-2165
PO9512140 Holencik II Subsidence, Houtzdale, Clearfield County, Pennsylvania, July 1995, TPO Ray Maits
412/937-2148
PO9512118 Romesberg Refuse Fire, Rockwood, Somerset County, Pennsylvania, May/June 1995, TPO Jeff Green 412/237-2151
PO9512083 Beimel Subsidence, Kersey, Elk County, Pennsylvania, March 1995, TPO George Popper 412/937-2165
PO9512613KP Evcic Subsidence, Woodward Twp., Clearfield County, Pennsylvania, February 1995 TPO George Popper 412/937-2165
PO9412243 Bills/Keefe Subsidence, Slickport (Mine Entry Collapse), Cambria County, PA , October 1994 TPO George Popper 412/937-2165
PO9412230 George Pothole Type Subsidence, Houtzdale, Clearfield County, PA, September 1994 TPO George Popper 412/937-2165
PO9412622 Pepperday Pothole Type Subsidence, Rush Township, Centre County, PA April 1994 TPO George Popper 412/937-2165
PO9412015 Groskin Pothole Type Subsidence, Penn Hills, Allegheny County, PA December 1993 TPO Rick Balogh 412/937-2136
PO9312370 Wilkinson Mine Drainage, Munson, Clearfield County, PA October, 1993 TPO Dan Pollack 412/937-2150
PO9312351 Rodkey Pothole Type Subsidence, Brisbin, Clearfield County, PA, July 1993 TPO George Popper 412/937-2165
PO9312345 Dishon Pothole Type Subsidence, Hudson, Clearfield County, PA, July 1993 TPO Dan Pollack 412/937-2150
P09312306 Harclerode Mine Drainage, Scalp Level, Cambria County, PA, June 1993 TPO Rick Balogh 412/937-2136
PO9312317 Persian Avenue Mine Blowout, Brisbin, Clearfield County, Pennsylvania, June 1993 TPO George Popper 412/937-2165
PO9312311 B.V. School Subsidence Insp., Nanty Glo, Cambria County, Pennsylvania, May 1993 TPO Dan Pollack 412/937-2150
PO9312234 Shrader Subsidence Inspection, Frostburg, Allegany Co., Maryland, Feb-Apr 1993 TPO Rick Balogh 412/937-2136
PO9212077 Stavish Mine Drainage Inspection, Barnesboro, Cambria County, Pennsylvania, Mar/Apr 1992 TPO Dan Pollack 412/937-2150
PO9212055 Semelsberger Shaft Subsidence Inspection, Barnesboro, Cambria County, Pennsylvania, Feb/Mar 1992 TPO Dan Pollack 412/937-2150
PO9212010 Malec Subsidence Inspection, Frostburg, Allegany Co., Maryland January, 1992, TPO Rick Balogh 412/ 937-2136
PO9113759 Sainato Subsidence Inspection, West Mifflin, Allegheny County, PA, October 1991, TPO Rick Balogh 412/937- 2136
PO9113761 Kashella Shaft Subsidence Inspection, Morrisdale, Clearfield County, Pennsylvania, July 1991, TPO Rick Balogh 412/937-2136
PO9113763 Focht Subsidence Inspection, Gearhartville, Clearfield County, Pennsylvania, June 1991, TPO Rick Balogh 412/937-2136
PO9112279 Bills Subsidence Inspection, Slickport, Cambria County, Pennsylvania, TPO Rick Balogh 412/937-2136
PO9113666 Gornati Mine Drainage Inspection, Coal Hollow, Elk County, PA, February 1991, TPO Dan Pollack 412/937-2150
PO9113638 Zemrose Subsidence Inspection, Barnesboro, Cambria County, PA, January 1991, TPO Dan Pollack 412/937-2150
P09013508 Crain Subsidence Inspection, South Philipsburg, Centre County, PA., September 1990, TPO Art Lees 412/937-2142
PO9013368 Tyler Tipple & Refuse Bank Inspection, Tyler, Huston Township, Clearfield Co., PA., February 1990, TPO Art Lees 412/237-2142
PO812970 Burkett Elementary School Subsidence, Robinson Township, CT813027 Allegheny County, Pennsylvania, August-October 1988 TPO Rick Balogh 412/937-2136
PO812906 Hoffman II Subsidence, Hermitage, Mercer County, CT812053 Pennsylvania, July-September, 1988 TPO: MaryBeth Marks 412/937-2138
PO812884 Robertson Road Subsidence, Baldwin Township, Allegheny County, Pennsylvania, June 1988 TPO: Bill Unger 412/937-2149
PO812872 & CT812054 Robert Culp Subsidence, Clarksburg, Harrison County, West Virginia, June, August-September 1988 TPO: Robert Coleman 412/937-2137
PO812777 & CT812046 McIsaac Subsidence, Ewingsville, Allegheny County, Pa. April, July 1988 TPO: Ron Mikolajczk 412/937-2132
PO812806 Slutzker/ Mosser Subsidence, Canton, Stark County, Ohio CT812041 Apr.-May, 1988 TPO: Bill Ehler 412/937-2839
CT735537 Berlin Subsidence, Berlin, Somerset County, Pennsylvania April 1987 TPO: Robert Coleman 412/937-2137
CT735019 Cedar Street Subsidence Inspection, Masontown, Fayette County, Pennsylvania Dec.1986-Jan.1987 TPO: Carmen Polino 412/937-2841
J6860165 Poplar Street Subsidence Inspection, Paint Borough, Somerset County, PA. Oct.1986 TPO: Keith Harrison 412/937-2848
J6860113 Reece House Repair Inspection, North Belle Vernon, Westmoreland County, Pennsylvania June/July 1986 TPO: Rick Balogh 412/937-2856
J6860094 Pontzer Subsidence Inspection, Kersey, Elk County, Pennsylvania May 1986 TPO: George Popper 412/937-2931
K6840118 Smith/Garvey Subsidence Inspection, Chester Hill, Clearfield Co., PA., June/July 1985 Meg Estep 412/937-2858
K6850103 Otterbein Subsidence Inspection, Osceola Mills, Clearfield County, Pennsylvania, May/June 1985 TPO: Meg Estep 412/937-2858
J5150014 Thompsonville Road Subsidence Inspection, Thompsonville, Washington County, PA. Oct.1984-Mar.1985 TPO: Lois Uranowski 412/937-2857
K6850084 Clearfield Mine Drainage Inspection, Clearfield, Clearfield County, Pennsylvania, June-Aug. 1984 TPO: Carmine Polino 412/937-2841
S5130061 Chalfant Street Subsidence, Chalfant Borough, Allegheny County, Pennsylvania Dec.1982-Dec.1983 TPO: Jim Kennedy 412/937-2844
J5201425 Charles Street Subsidence, Wheeling, West Virgina June 1981-Sept. 1982 TPO: Jim Kennedy 412/937-2844
J5201425 Renton Mine Fire, Plum Borough, Allegheny County, PA. Jan./Feb.1981 TPO: Rick Balogh 412/937-2856
J5201425 Dakota Street Subsidence, Pittsburgh, Allegheny County, PA. Nov./Dec.1980 TPO: Rick Balogh 412/937-2856
J5201425 Route 924 Subsidence (ANTHRACITE) Sheppton, Schuylkill County, Pennsylvania Sept/Oct.1980 TPO: Carl Sauer 717/826-6726
J5201425 Midway Subsidence, Midway, Washington County, Pennsylvania June/July 1980 TPO: Robert Coleman/Tilak Verma 412/937-2137
PO5201210 RFP Preparation For OSM AML Investigations, Charleston, West Virginia Office, 1980 TPO: Earl Cunningham
Related Experience
Co-Author of a self-instructional manual for the U.S. Geological Survey and Office Of Surface Mining entitled "Low Altitude Photo-interpretation Manual For Surface Coal Mining Operations." Published November 1983 by Resource Technologies Corporation, State College, PA 16804.
Technical advisor for a 1981 study for the Office of Surface Mining entitled "Concepts For Protection Against Catastrophic Events Resulting From Coal Mining."
Principal Investigator responsible for the technical leadership of a study for the U.S. Bureau Of Mines entitled "Defining The Anthracite Resources Of Northeastern Pennsylvania." This 1984 report defines the physical size and geologic distribution of anthracite coal resources in Pennsylvania that are potentially recoverable using surface and underground mining methods. It also presents an analysis of the potential market value of this energy resource.
1965-1980: HRB-SINGER, INC. - ENERGY & NATURAL RESOURCES DEPARTMENT
Principal Geologist responsible for the management and technical direction of research proposal efforts, projects, and the expansion into new areas of technology.
Later efforts include applied research into pre-mining identification of hazards associated with coal mine roof measures, a technology assessment of energy development in Appalachia, and geotechnical research in land subsidence resulting from underground mining, sinkhole development in karst terranes, and drainage of coastal organic wetlands.
Earlier efforts include development of a maximum subsidence prediction model resulting from research on subsidence potential in the Anthracite Region of Northeastern Pennsylvania. This model was improved and modified to fit conditions in the Eastern Bituminous Coal Fields in subsequent research on the impact of overmining and undermining on the Eastern Underground Coal Reserve Base.
Additional efforts were in the application of color and color IR photography in vegetation monitoring of reclaimed stripped coal lands; the longterm effectiveness of mine seals in acid mine drainage abatement; assessment and evaluation of the natural resources of Appalachia; regional analysis of coal resources in the United States; application of digital processing techniques for airborne and satellite data to the solution of environmental problems; and the application of remote sensing data as an aid in geotechnical analysis.
Senior Research Geologist specializing in field operational management of airborne thermal infrared imaging surveys and development of techniques and criteria applicable to specific terrane problems. Project Director, Connecticut River Thermal Pollution Survey, Piscataqua River Current Survey, Geological Survey in Northern Alberta, Canada, and the ESSA Atmospheric Physics Data Collection Project in Colorado. Proposal preparation for domestic and foreign remote sensing data collection and analysis efforts.
Research Geologist directing in-house research into the application of airborne thermal infrared imaging techniques to geoscience data collection with emphasis on the collection and interpretation of regional infrared mosaics. Participated in and directed the Merrimack River survey, airborne infrared experiments in eastern Canada, surveys of the shorelines of Lake Erie and Ontario, subsurface burning coal refuse piles in Pennsylvania, and gas transmission line right-of-ways in New York, Pennsylvania, and West Virginia.
1959-1965: THE PENNSYLVANIA STATE UNIVERSITY
Graduate Research and Teaching Assistant, Department of Geology and Geophysics, Coal Research Laboratory. Extensive research on fossil spores and pollen; field work (Summer 1960) in the Everglades National Park, Florida, collecting and studying organic sediments and modern environments of coal deposition. Teaching Laboratory Sections in Physical Geology, Historical Geology, and Paleobotany. Temporary staff appointment (Summer 1965), Department of Geology and Geophysics, teaching the Geology of the United States.
1962-1963: THE CITY COLLEGE OF NEW YORK
Lecturer in Geology: (Summers Only)
HONORS
NSF/ASP Visiting Scientist: 1968-69. 1969-1970. Presented lectures on remote sensing at Indiana University Of Pennsylvania, The University of Virginia, The University of Tennessee, The University of Georgia, and The Louisiana State University.
Carnegie Teaching Internship: 1963, City College Of New York.
New Jersey Zinc Company Research Fellowship: 1957-1959, Lehigh University
INVITED SPEAKER
Subsidence Workshop, The Pennsylvania State University, Capitol Campus, 1979.
Central Pennsylvania Chapter, Association of Professional Engineers, 1978.
Geotechnical Group, Central Pennsylvania Section, American Society of Civil Engineers, 1977.
Remote Sensing Symposium, U.S. Army Corps of Engineers, L. B. Johnson Space Center, Houston, Texas, November 1973.
Symposium on Remote Sensing of the Atmosphere from Aircraft, ASM/NCAR, Boulder, Colorado, April 1970.
Remote Sensing of Natural Resources Institute, University of Wisconsin, January 1970.
Symposium of Remote Sensing Application in Agricultural and Natural Resource Research, The Pennsylvania State University, June 1969.
First Annual International Remote Sensing Institute (IRSI) Symposium, Sacramento, California, April 1969.
MEMBERSHIPS
Senior Fellow, Geological Society Of America
American Institute of Professional Geologists
LISTINGS
American Men of Science, Sixth Supplement
SELECTED PUBLICATIONS AND REPORTS
2002, (and Kern, Jeffrey R.) Appraisal Report-Leeward Quarry, Lackawaxen Township, Pike County, Pennsylvania,
2000, Environmental Site Assessment Phase 1 Report, Parcel 12-004-,200A-,0000-, Lot 13 Airport Park, Benner Township, Centre County, Pennsylvania, Report Prepared for Keystone Financial Bank NA, Altoona , Pennsylvania.
2000, Environmental Site Assessment Phase 1 Report, Parcel 18-024-,002A, Lots 4 & 5, Hawbaker Industrial Park, Centre County, Pennsylvania, Report Prepared for Keystone Financial Bank NA, State College, Pennsylvania.
1999, Environmental Site Assessment Phase 1 Report, Rolling Meadows Estate, Centre County, Pennsylvania, Report prepared for Keystone Financial Bank, NA, State College, Pennsylvania
1999, Environmental Site Assessment Phase 1 Report, Parcel 18-03-50 Centre County, Pennsylvania, Report prepared for Mid State Bank, State College, Pennsylvania
1999,(and Kern, Jeffrey R., Torries, Thomas F., and WelschDavid H.) Using Spatial Characteristics, Markets, and GIS Modeling to Determine Time of Mining of Individual Properties in Areas of Large Coal Reserves, Presented at APCOM99 Conference, Denver, Colorado.
1997, Environmental Site Assessment Phase 1 Report, Parcel 24-433/26 Centre County, Pennsylvania, Report prepared for Mid State Bank, State College, Pennsylvania
1994, (and Kern, Jeffrey R.) Appraisal of the Dimension Stone Reserves Located in Minnesota, South Dakota, and Texas Owned By the Cold Spring Granite Company; Report Prepared For Barclays Business Credit, Chicago Office.
1990, Centre Hall, Pennsylvania Water Supply Project- Hydrogeologic Analysis; Report Prepared For Sanders, Walls, and Wyre, Inc. Consulting Engineers, State College, Pennsylvania.
1989, (and Kern, Jeffrey R.) Analysis Of Coal Tipple And Loadout Needs Along The Monongahela River From Milepost 60 Below The Maxwell Lock And Dam To Milepost 100 Above Lock And Dam Number 8; Contract DACW69-89-D-0012-0001, U.S. Army Corps Of Engineers, Huntington District, Huntington , West Virginia.
1989, (and Kern, Jeffrey R.) Appraisal Report Of Mineral Interests On The Proposed Federal Prison Site Near Manchester, Clay County, Kentucky; P.O. #3681, R.P.#9358 Bureau Of Prisons, Washington, D.C.
1989, (and Kern, Jeffrey R.) Appraisal Of CONSOL Coal Properties, Greene County, Pennsylvania; Greene County Assessment Office, Waynesburg, Pennsylvania.
1988, Hoffman II Subsidence, Hermitage, Mercer County, Pa. Geotechnical Analysis-Final Report; Contract EC68-CT8-12053, Office Of Surface Mining, Eastern Technical Center, Pittsburgh, PA.
1988, (and Walls, Charles E.) Burkett Elementary School, Robinson Township, Allegheny County, Pa - Geotechnical Analysis- Final Report; Contract EC68-CT8-13027, Office of Surface Mining, Eastern Technical Center, Pittsburgh, PA.
1988, (and Walls, Charles E.) Robert Culp Subsidence, Clarksburg, Harrison County, West Virginia - Subsurface Investigation and Analysis; Contract EC68-CT8-12054, Office of Surface Mining, Eastern Technical Center, Pittsburgh, PA.
1988, (and Walls, Charles E.) McIsaac Subsidence, Ewingsville, Collier Township, Allegheny County, Pa. - Subsurface Investigation and Analysis, Contract EC68-CT8-12046, Office of Surface Mining, Eastern Technical Center, Pittsburgh, PA.
1988, (and Kern, Jeffrey R.) Appraisal of: Anna Mae Casiello Property, Parcel: Route 55 Freeway, Section 13, Parcels 11A and 11B, Specialists Report: Mineral/ Soil Extraction Appraisal; Contract 1989-A-56, New Jersey Department of Transportation, Freehold, New Jersey.
1988, (and Kern, Jeffrey R.) Appraisal Report for the Jones Et. Al. Property, COE Tract #1255M), Stonewall Jackson Lake Project, Lewis County, West Virginia; Contract DACW69-85-D-0018 W.O. #0005, U.S. Army Corps of Engineers, Huntington, West Virginia.
1987, (in Kern, Jeffrey R.) UMTRA Project Appraisal of Surface and Coal Estates, COE Tracts 201 and 201E, Burrell Township, Indiana County, Pennsylvania; Appendix B: Coal Report, Contract DACW69-88-M-0127; RE-87-115; U.S. Army Corps of Engineers, Huntington, West Virginia.
1985, (and Kern, Jeffrey R.) Mineral Land Appraisal Analysis, State vs. The Neptune Corporation, Route 195, Section 7, Parcels 10A, 10B, 10C, 10D, 10E, 10F; Route 38, Section 10, Parcels 1A, 1B, 1C, 1D; Contract 1984-A-155, New Jersey Department of Transportation, Trenton, New Jersey.
1984, Coal Reserve Report, Frailey/ Reilly Townships, Schuylkill County, Pennsylvania; Private Client.
1984,(and Kern, J. R., McGrory,B.J.) Defining The Anthracite Resources of Northeastern Pennsylvania, Contract No. J0333932, U.S. Bureau of Mines, Pittsburgh Mining Research Center; Resource Technologies Corporation Final Report #1003-F.
1983, Investigation of Problems Arising from Abandoned Mined Lands - Chalfant Street Subsidence, Chalfant Borough, Allegheny County, Pennsylvania; Contract No. S5130061, Office of Surface Mining, Eastern Technical Center, Pittsburgh, Pennsylvania; Resource Technologies Corporation Final Report #1021-F.
1983, (and Evans, B. M., Kern, J.R.) Low Altitude Photo-interpretation Manual for Surface Coal Mining Operations; Resource Technologies Corporation, P.O. Box 242, State College, Pennsylvania, 16804
1982, Investigation of Problems Arising from Abandoned Mined Lands - Nelson/Jordan Community Center, Wheeling, West Virginia; Contract No. J520145, Office of Surface Mining, Eastern Technical Center, Pittsburgh, Pennsylvania; Resource Technologies Corporation Completion Report #1002-5-F.
1981, Investigation of Problems Arising from Abandoned Mined Lands - Nelson/Jordan Community Center, Wheeling, West Virginia, Report on Site Investigation and Analysis of Subsurface Data; Contract No. J520145, Office of Surface Mining, Region I, Charleston, West Virginia; Resource Technologies Corporation Interim Report #1002-5-I.
1981, (and Kern, J. R., et. al.) Concepts for Protection Against Catastrophic Events Resulting from Coal Mining, Contract No. J5101061, Office of Surface Mining, U.S. Dept. Of The Interior, Washington, D.C.; Resource Technologies Corp. Final Rpt #1004-F.
1979, (et. al.) Premining Identification of Hazards Associated with Coal Mine Roof Measures; Contract No. J0177038, United States Bureau of Mines, Pittsburgh, Pennsylvania; HRB-Singer, Inc. Final Report #516-F.
1977, A Bibliography of Appalachian Coal Resources and Reserves; prepared for Batelle Columbus Laboratories, 21 p.
1976, (et. al.) The Impact of Overmining and Undermining on the Eastern Underground Coal Reserve Base; Contract No. J0357129, United States Bureau of Mines, Pittsburgh; HRB-Singer, Inc. Final Report #500302-F.
1976, (and Schad, J. A.), Remote Sensing Survey and Analysis - Legislative Route 313 - Philipsburg to Kylertown, Pennsylvania; HRB-Singer, Inc. Final Report #500302-F.
1975, (Stingelin, et al.), Subsidence Potential in Pennsylvania Coal Fields, Report No. ARC-73-111-2552, Appalachian Regional Commission; HRB-Singer, Inc. Final Report #4779-F.
1974, (and Gordon, R.), Program Design for Energy in Appalachia, Chapter 5 in Environmental and Natural Resources Program Design, a report to the Subcommittee on Environmental and Natural Resources, Appalachian Regional Commission.
1973, (and Stamm, E.), Remote Sensing Survey and Analysis - Legislative Route 1061, Sections 6 and 7, Blair County, Pennsylvania; GeoSurveys, Camp Hill, Pennsylvania; HRB-Singer, Inc. Final Report #454803-F-2.
1973, Airborne Thermal Imaging; Remote Sensing Symposium, United States Army Corps of Engineers, L. B. Johnson Space Center, Houston, Texas, November 26-30; HRB-Singer, Inc. Special Paper S-328.
1973, (and Avis, G. B.), Digital Processing Techniques in Thermal Plume Analysis: Proceedings of the International Symposium on Remote Sensing and Water Resources Association, June 11-14, Burlington, Canada.
1972, (and Fisher, W.), Airborne Infrared Survey of the Poor Mountain Virginia Pumped Storage Site; Contract No. E9481, Stone & Webster Engineering Corp., Boston, MA., HRB-Singer, Inc. Final Report #454803-F-1.
1972, (and Fisher, W.), Airborne Infrared Survey of the Bath County Virginia Pumped Storage Site, Contract No. E9481, Stone & Webster Engineering Corp., Boston, MA.; HRB-Singer, Inc., Final Report #454803-F-2.
1972, (and Avis, G. B.), Digital Processing of Airborne Infrared Imaging Signals; Proceedings of the 24th International Geological Congress, Montreal, Canada, Section 16, pp.82-88.
1971. (and Knuth, W.), Digital Analysis of Infrared Signals from the Revloc Pennsylvania Coal Refuse Bank; Agreement No. 70-15, The Pennsylvania Department of Environmental Resources; HRB-Singer, Inc. Final Report #450101-R-3.
1971, Airborne Infrared Imagery and its Limitations in Civil Engineering Practice; Symposium on Remote Sensing, Highway Research Board, January 19, 1972, Washington, D.C.
1971, (and Traxler, B. T.), A Quantitative Airborne Infrared Imaging System; Proc. of the Seventh Symposium on Remote Sensing of Environment; Univ. of Mich., Institute of Science Technology, May 17-21, 1971.
1971, (and Knuth, W.), Airborne and Ground Geologic Analysis of Subsurface Burning at Coal Hill, Snowshoe, Pennsylvania; Agreement No. 70-15, The Penn. Dept. of Envir. Resources; HRB-Singer, Inc., Final Report #450101-R-1.
1971, (Stingelin, et al.), An Airborne Infrared and Ground Analysis of Ten Selected Coal Refuse Banks in the Pennsylvania Anthracite Region; Contract No. S0101825, U.S. Bureau of Mines, Washington, D.C.; HRB-Singer, Inc. Final Report #4480-F.
1970, (and Taylor, J. I.), Environmental Applications of Thermal Imaging; Presented at Symposium of Commission VII - Photointerpretation, International Society for Photogrammetry, September 1970, Dresden, German Democratic Republic.
1969, Airborne Thermal Scanning in Geoscience Data Acquisition; Proceedings Symposium and Short Course on Remote Sensing, International Remote Sensing Institute, 6151 Freeport Boulevard, Sacramento, California 95822, Vol. I, pp. 175-182.
1969, Tandem Use of an Airborne Infrared Scanner and Fixed-field Radiometer in Geoscience Data Acquisition; (Abstract) 1969 International Geoscience Electronics Symposium, I.E.E.E.
1969, Operational Airborne Thermal Imaging Surveys; Geophysics, V. 34, No.5, (October 1969). pp. 760-771.
1969, (and Taylor, J. I.), Infrared Imaging for Water Resources Studies; Proceedings Paper N0. 6331, Journal of the Hydraulics Division, A.S.C.E., V. 95, No. HY. 1.
1968, (Stingelin, et al.), Aerial Infrared Survey of a Sealed Coal Mine near Kittanning, Pennsylvania: P.O. 2252-67, U.S.B.M., Pittsburgh; HRB-Singer, Inc. Final Report #941-F.
1968, (and Knuth, W. M., Fisher, W., Jr.), Detection, Delineation, and Monitoring of Subsurface Coal Fires by Aerial Infrared Scanning; Proceedings of the Fifth Michigan Symposium on Remote Sensing of Environment, Institute of Science and Technology, Report No. 4164-18-X, pp.877-881.
1968, A Record In Peat Found In Bear Meadows, Short Circuit, Vol.18, N0.1, pp.3-4. HRB-Singer, Inc. State College, Pennsylvania
1968, An Application of Infrared Remote Sensing to Ecological Studies; Bear Meadows Bog, Pennsylvania; Proceedings of the Fifth Michigan Symposium on Remote Sensing of Environment, Institute of Science and Technology, Report No. 4164-18-X, pp. 434-440.
1967, (and Fisher, W., Jr.), Advancements in Airborne Infrared Imaging Techniques in Hydrological Studies; Proceedings of the Third Annual Water Resources Conference; American Water Resources Association, San Francisco, California, November 10, 1967, pp. 466-471.
1967, (and Ames, H. T.), Evidence for Aeolian Redeposition of Paleozoic Sporomorphs, Bear Meadows Bog, Pennsylvania; (Abstract) Annual Meeting, Northeastern Section, Geological Society of America, p.59.
1966, (and Ory, T. R.). Airborne Infrared Survey Experiments in Canada; Contract No. HO-55845, Geological Survey of Canada, Ottawa; HRB-Singer, Inc. Final Report #941-F.
1965, Late-glacial and Post-glacial Vegetational History in the Northcentral Appalachian Region; Ph.D. Dissertation, The Pennsylvania State University, Department of Geology, 193 pages; (Abstract) Dissertation Abstracts, V. XXVI, Number 11, 1966; (Abstract) Annual Meeting, Geological Society of America, New Orleans, Louisiana, November 20-22, 1967.
1959, Phyto-geologic Relationships in the Vicinity of Bethlehem, Pennsylvania; M.S. Thesis, Lehigh University, Department of Geology
For further information, send mail to Karl Lasher
or telephone 717-783-0709
Mineral Resources Management Homepage
Mining & Reclamation
District Mining Operations
Deep Mine Safety
Abandoned Mine Reclamation
Oil & Gas Management